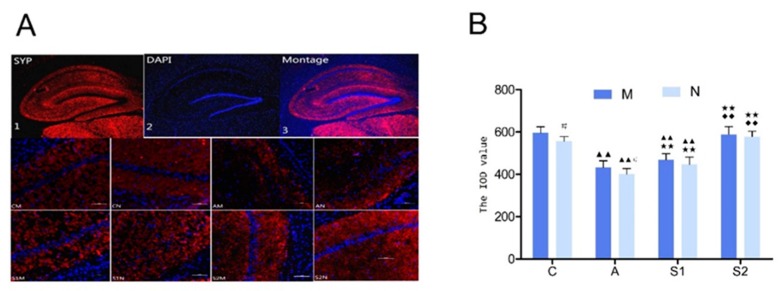
Figure 4.
(A): Representative images showing the expression levels of synaptophysin (Syp) in the rat hippocampal dentate gyrus (DG) region, which were assessed by immunofluorescent staining and captured by laser confocal scanning microscopy (× 200 magnification; the scale bar indicates a length of 100 µm). The red fluorescence was Syp of Cy3, blue fluorescence was the nuclei of DAPI-labeled hippocampal neurons, and the superimposed image. (B): Changes of integral optical density (IOD) levels of Syp in the hippocampus DG region, which were calculated by image processing analysis. Data are presented as Mean ± SD (n = 10/group). The in-graph symbols indicate: ▲▲ p < 0.01 versus Group C; ** p < 0.01 versus Group A; ◆◆ p < 0.01 versus Group S1; # p < 0.05 versus Group M.

