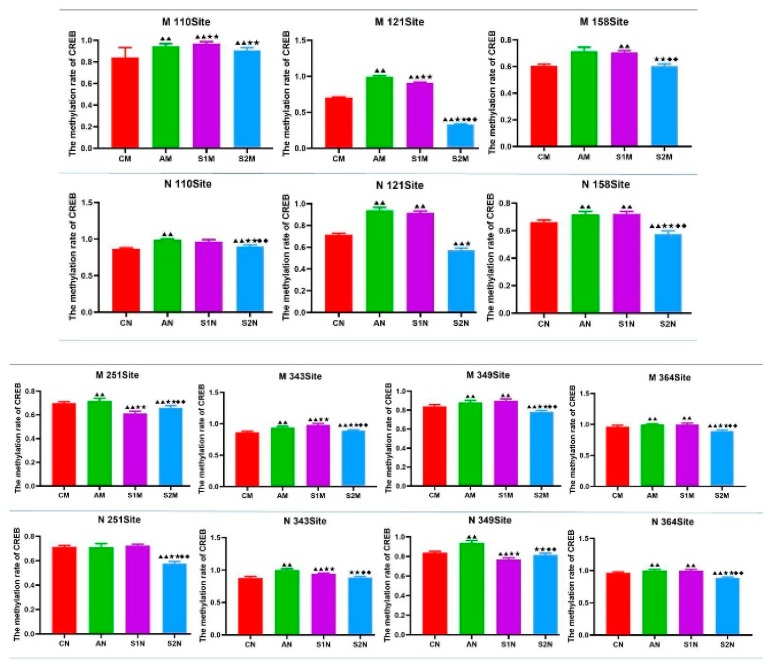
Figure 9.
Comparison of DNA total methylation rate at each of the 7 sites of CREB gene in rat hippocampus under various treatment conditions. The fragment containing nucleotide 56–470, with concentrated CpG sites, was selected as the target sequence. Data are presented as Mean ± SD (n = 10/group). The in-graph symbols indicate: ▲ p < 0.05, ▲▲ p < 0.01 versus group CM or CN; * p < 0.05, ** p < 0.01 versus group AM or AN; and ◆ p < 0.05, ◆◆ p < 0.01 versus group S1M.

