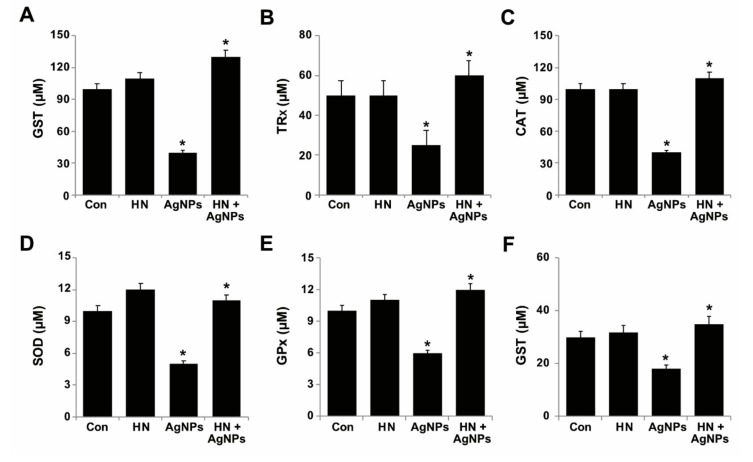
Figure 8.
Effect of HN on AgNPs-induced reduction of antioxidant markers. SH-SY5Y cells were pretreated with or without 10 μg/mL HN for 24 h. Cells were then treated with 10 μg/mL HN and/or 10 μg/mL AgNPs for 24 h. After incubation, the cells were harvested and washed twice with an ice-cold phosphate-buffered saline solution. The cells were collected and disrupted by ultrasonication for 5 min on ice. (A) GSH concentration is expressed in micromoles. (B) TRX is expressed in micromoles. (C) Catalase concentration is expressed in micromoles (D) SOD is expressed in micromoles. (E) GPx concentration is expressed in micromoles. (F) GST concentration is expressed in micromoles. Results are expressed as mean ± standard deviation of three independent experiments. There was a significant difference in treated cells compared to untreated cells, Student’s t-test (* p < 0.05).

