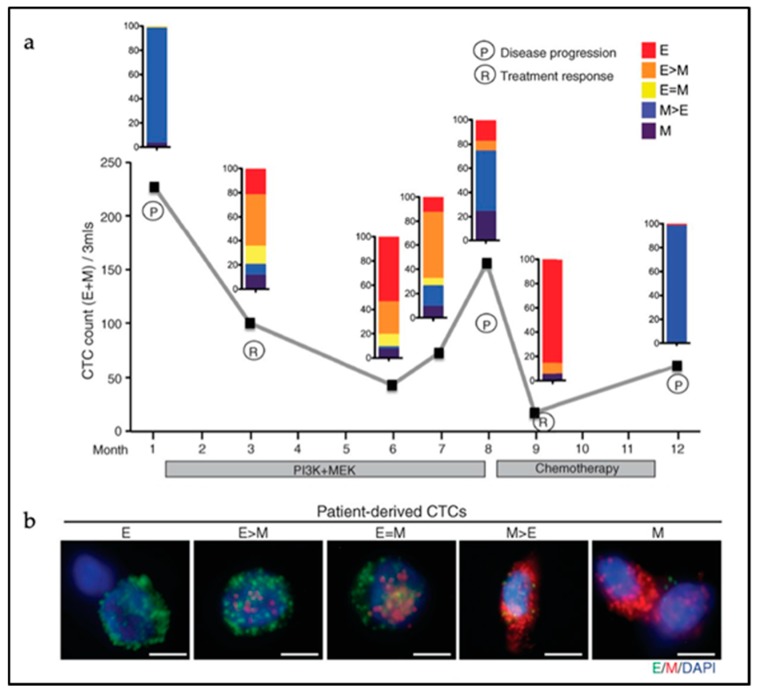
Figure 3.
EMT features in single circulating tumor cells (CTCs) and CTC clusters from a metastatic breast cancer patient. (a) Longitudinal monitoring of EMT features in CTCs. The Y-axis indicates the number of CTCs per 3 mL of blood. The patient was monitored over time (X-axis) during treatment with inhibitors targeting the PI3K and MEK pathways (months 1–8), followed by chemotherapy with Adriamycin (8–12). The color-coded quantification bars indicate the EMT status of the CTCs based on RNA-ISH (in situ hybridization) analysis at each indicated time point. P = disease progression; R = tumor response. (b) RNA-ISH analysis of EMT markers in CTCs derived from patients with metastatic breast cancer. Green dots represent epithelial (E) and red marks mesenchymal (M) markers. Scale bar: 5 µm. Adapted from [93].

