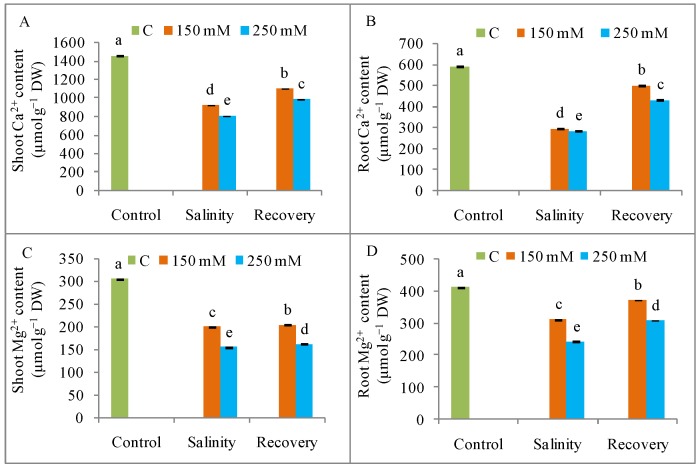
Figure 5.
Content of Ca2+ and Mg2+ (A) shoot Ca2+, (B) root Ca2+, (C) shoot Mg2+, and (D) root Mg2+ in tomato plants under salinity (150 and 250 mM NaCl) and after a 48 h recovery period. Data means (±SD) were calculated from three replications. Statistically significant values are indicated by dissimilar letters (Fisher’s LSD test, P ≤ 0.05).

