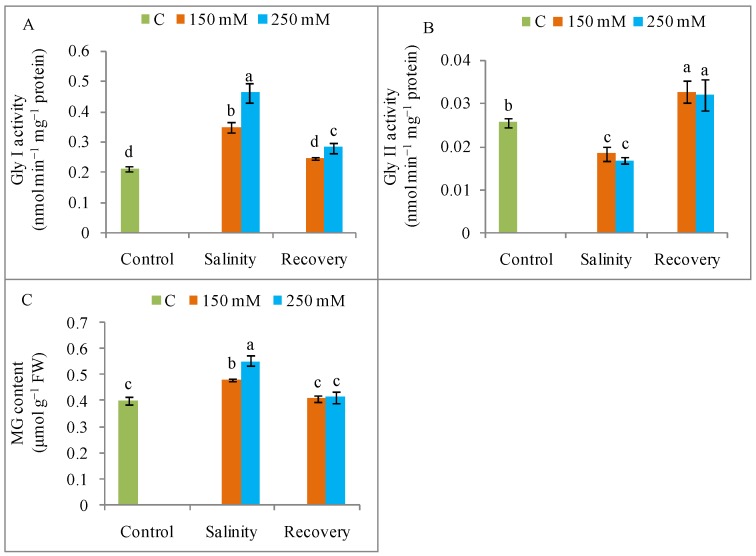
Figure 14.
Methylglyoxalase detoxification (A) and activities of glyoxalase enzymes (B) Gly I, (C) Gly II in tomato plants under salinity (150 and 250 mM NaCl) and after a 48 h recovery period. Data means (±SD) were calculated from three replications. Statistically significant values are indicated by dissimilar letters (Fisher’s LSD test, P ≤ 0.05).

