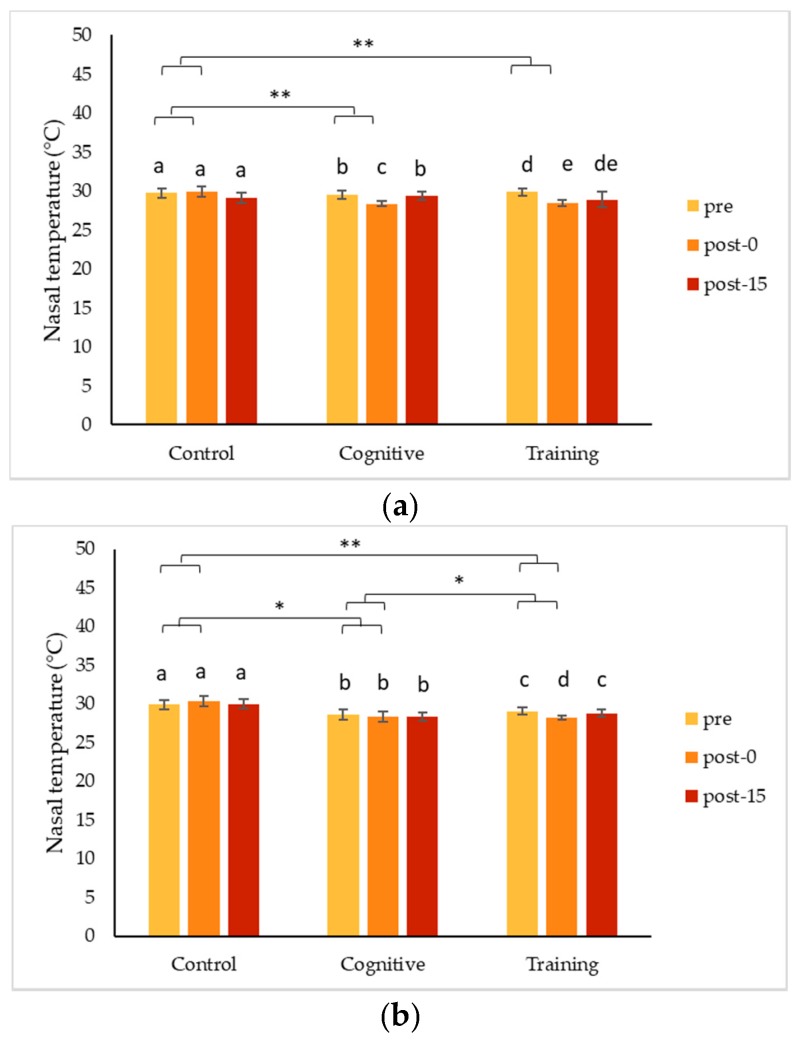
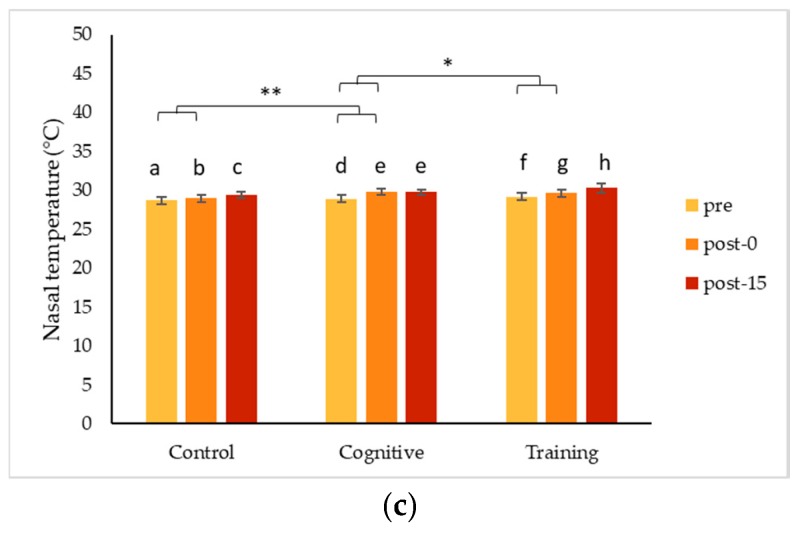
Figure 3.
Minimum nasal temperatures (mean ± standard error) across three time points for two types of human–animal interactions and a control condition for (a) Chip; (b) Pende; and (c) Kongo. Brackets with ** indicate a significant difference of p < 0.05 and * indicate a trend (0.05 ≤ p < 0.1) for changes in temperature (calculated by subtracting pre from post-0 measurements) between conditions. Bars with different letters within a condition are significantly different or trending at p < 0.10 comparing time points within that condition. All tests were conducted using Wilcoxon signed rank tests with Monte Carlo sampling.


