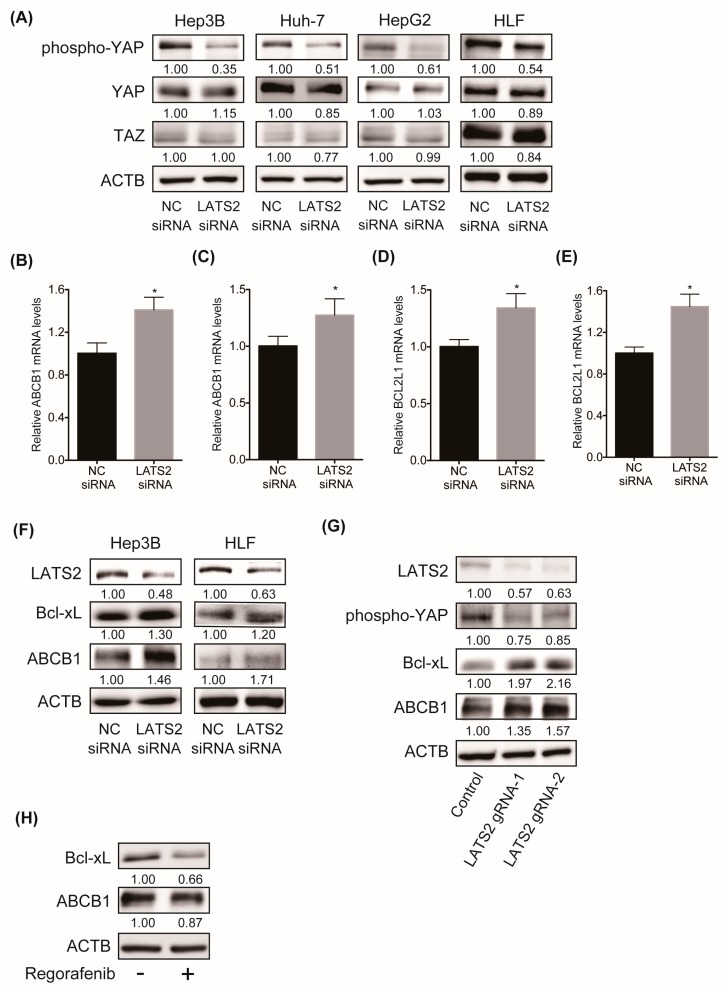
Figure 4.
(A) WB analysis of phosphorylated YAP, whole YAP and TAZ protein levels in four human liver cancer cell lines four days after transfection with the NC or LATS2 siRNA. Relative band intensity is shown. (B,C) ABCB1 mRNA levels in Hep3B (B) and HLF (C) cells three days after transfection with the NC or LATS2 siRNA (N = 4 for each and * p < 0.05). (D,E) BCL2L1 mRNA levels in Hep3B (D) and HLF (E) cells three days after transfection with the NC or LATS2 siRNA (N = 4 for each and * p < 0.05). (F) WB analysis of the protein levels of LATS2, Bcl-xL, and ABCB1 in Hep3B and HLF cells five days after transfection with the NC or LATS2 siRNA. Relative band intensity is shown. (G) WB analysis of the protein levels of LATS2, phosphorylated YAP, Bcl-xL and ABCB1 in Cas9-expressing HLF cells transduced with negative control gRNA or LATS2 gRNA. Relative band intensity is shown. (H) WB analysis of the protein levels of Bcl-xL and ABCB1 in Hep3B cells treated with either DMSO or 2 μM regorafenib for 48 hours. Relative band intensity is shown.

