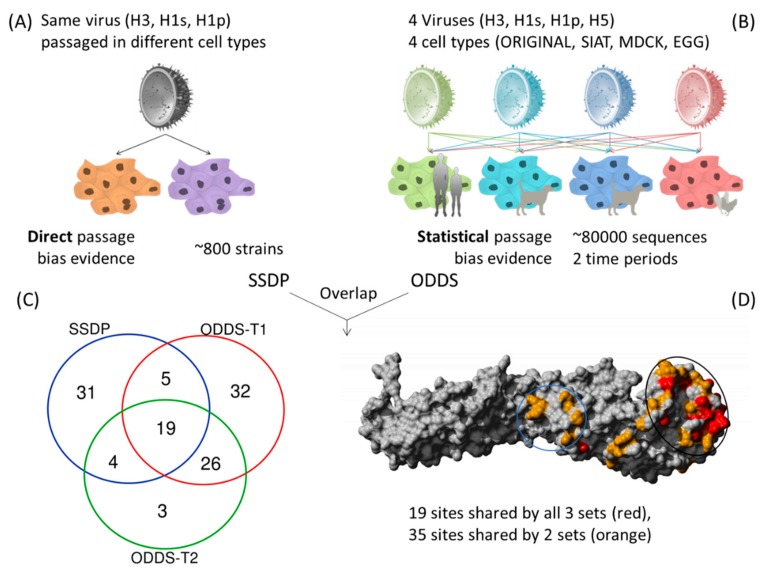
Figure 2.
Approach and data types for identification of common passage bias sites. (A) Direct evidence from same strain with different passage (SSDP), (B) geometric mean of odds ratios >5 from large statistical analysis over two time periods, (C) Venn diagram of overlap between SSDP and ODDS sets from two time periods. 54 sites are found in at least 2 of these sets of analyses, (D) Structural positions of dominant passage bias sites in HA. Black circle indicates receptor binding head region (i). Blue circle shows region undergoing pH dependent structural changes during fusion (ii). A third identified passage region is not shown as it is in the unstructured signal peptide region (iii).

