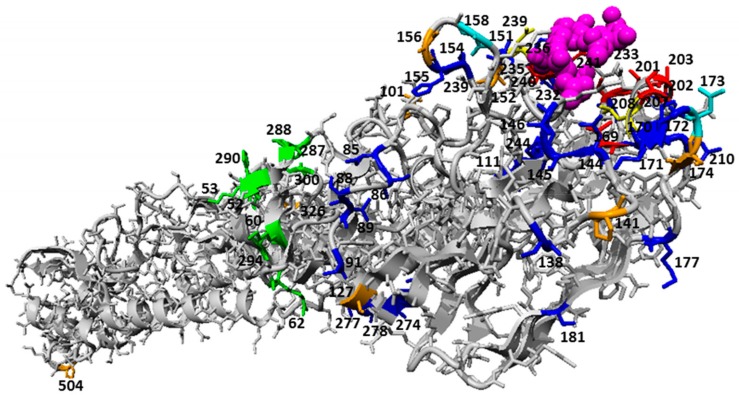
Figure 3.
Pairs of sites with significantly different association between passages after Bonferroni correction mapped to HA monomeric structure (PDB 3UBN) in context of common passage bias sites. Structural positions of dominant passage bias sites and sites undergoing epistatic interactions that are under the influence of passage bias adaptations are highlighted in the Figure. The ligands (sialic acid and N-acetyl glucosamine) are shown in pink ball representation. Epistatic sites are highlighted in orange. Passage bias sites (with high geometric mean of odds ratio across subtype and cell combinations) in the receptor binding region are colored in red and sites 208 and 239 which overlap with epistatic sites are colored in yellow (i). The rest of the passage bias site in the globular head region are colored in blue. Sites 158 and 173 which overlap with epistatic sites are highlighted in cyan. Sites colored in green lie at a region undergoing pH dependent structural changes during fusion (ii). A third identified passage region is not shown as it is in the unstructured signal peptide region (iii).

