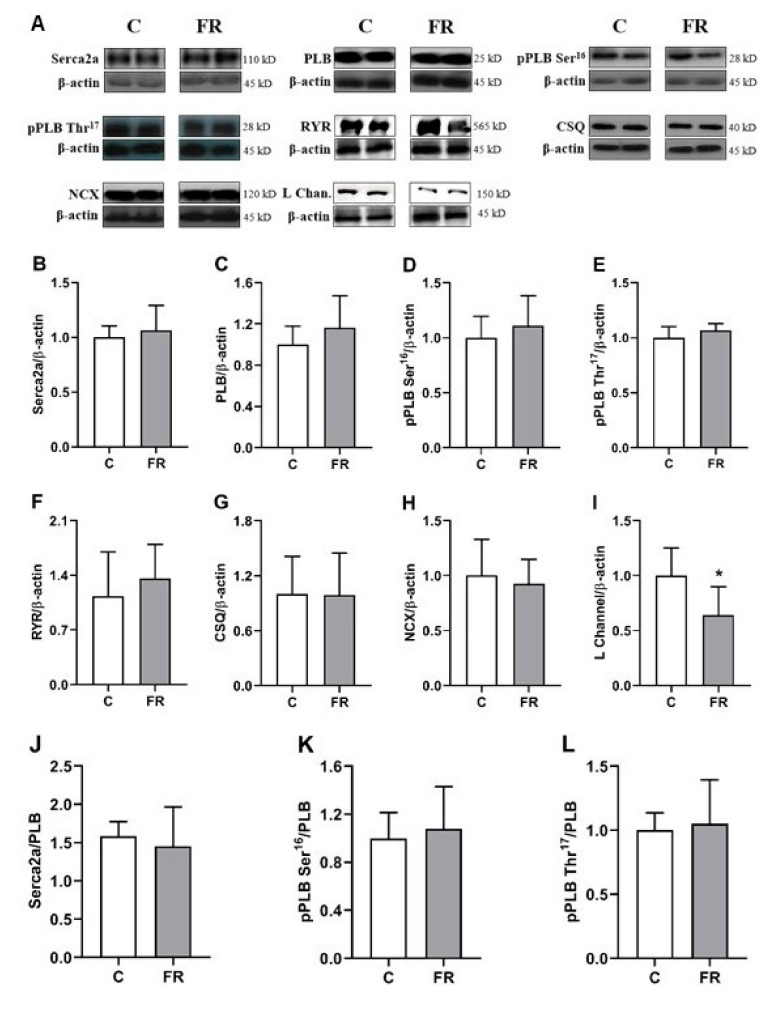
Figure 3.
Protein expression of calcium-handling regulators evaluated by Western blot in the myocardium from control (C) and food restriction groups (FR) (n = 6 in each group). (A) Representative bands of the proteins. Quantification of myocardial (B) sarcoplasmic reticulum calcium-ATPase (SERCA2a), (C) total phospholamban (PLB), (D) phosphorylated PLB on serine-16 (pPLB Ser16), (E) phosphorylated PLB on threonine-17 (pPLB Thr17), (F) ryanodine receptor (RYR), (G) calsequestrin (CSQ), (H) sodium-calcium exchanger (NCX), and (I) L-type Ca2+ channel (L Channel) normalized to β-actin (internal control). Quantification of (J) SERCA2a, (K) pPLB Ser16, and (L) pPLB Thr17 normalized to total PLB. Data are expressed as mean ± standard deviation. Student’s t-test for independent samples. * p < 0.05 vs. C.

