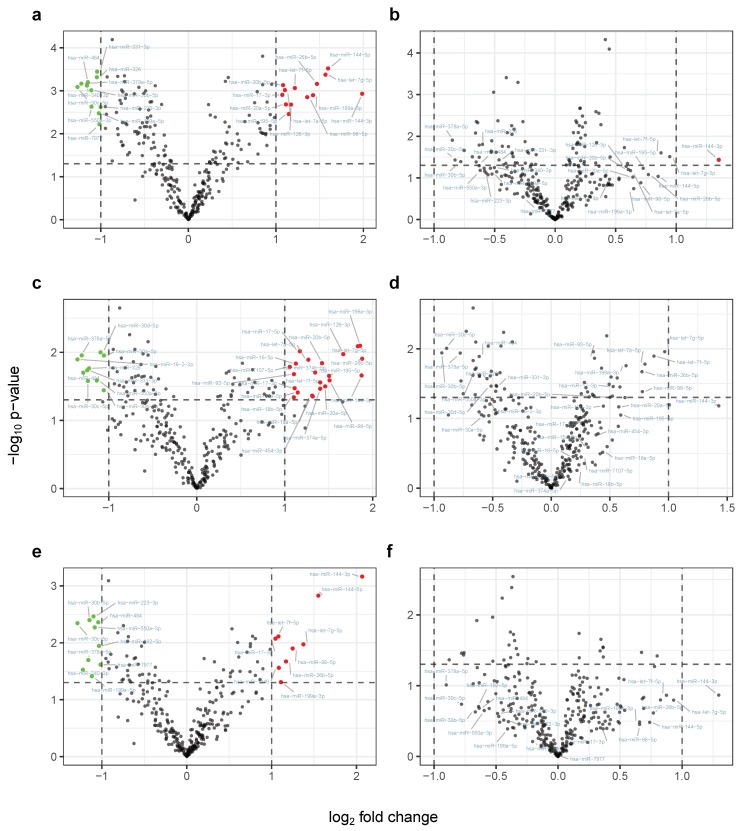
Figure 3.
Volcano plots for six comparison setups using 307 microRNAs. The x-axis indicates log fold change, while the y-axis refers to the negative decade logarithm of p-values from student’s t-tests (unadjusted). Dashed horizontal lines indicate a p-value of , while dashed vertical lines indicate a log fold change of 2. (a) Pooling the samples from the two participant groups and using timepoints of the first training interval ( and ); (b) pooled sample approach analogous to (a) but with timepoints from the second training period ( and ); (c) analysis for timepoints like in (a) only using samples from the first treatment group; (d) analysis for timepoints like in (b) only using samples from the first treatment group; (e) analysis for timepoints like in (a) only using samples from the second treatment group; (f) Analysis for timepoints like in (b) only using samples from the second treatment group. MiRNAs that exceed both axis thresholds (dashed lines) are colored according to their direction of dys-regulation, i.e., red for up-regulation and green for down-regulation after training. For each row of panels, significantly de-regulated miRNAs on the left side (panels (a,c,e) are labelled and displayed on the corresponding right side (panels b,d,f).

