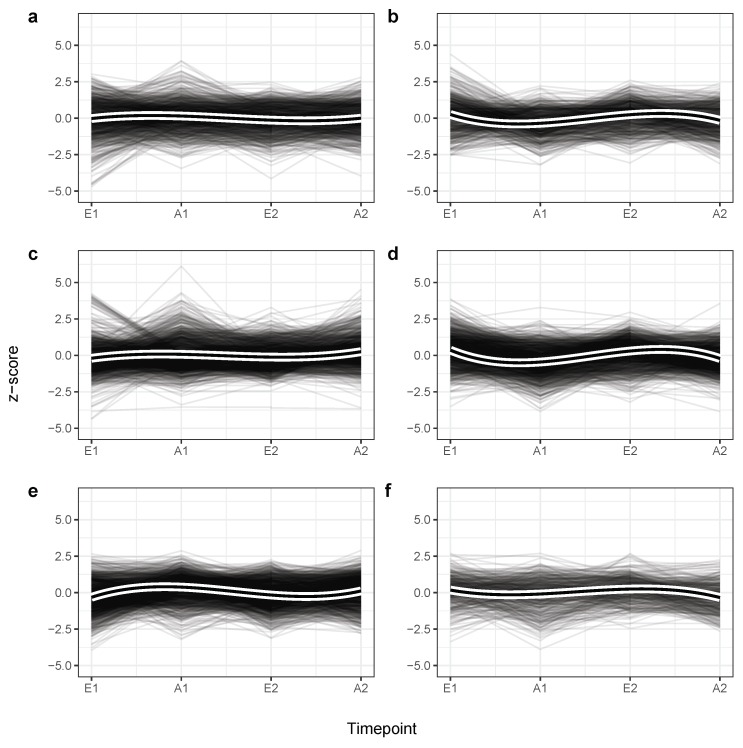
Figure 4.
Distribution of Z-scores into six miRNA clusters – corresponding to panel (a–f), along the four study timepoints using all samples. Each single grey line corresponds to one miRNA expression profile for one participant. Thick black lines display cluster-specific and smoothed curves of a cubic b-spline basis (). The distinct clusters contain microRNAs that exhibit similar expression patterns over time. Although every cluster exhibits a wave-like expression pattern, miRNAs in , , show a tendency to be up-regulated after training (up, down, up) while those in , , and tend to be down-regulated after a period of endurance exercise (down, up, down).

