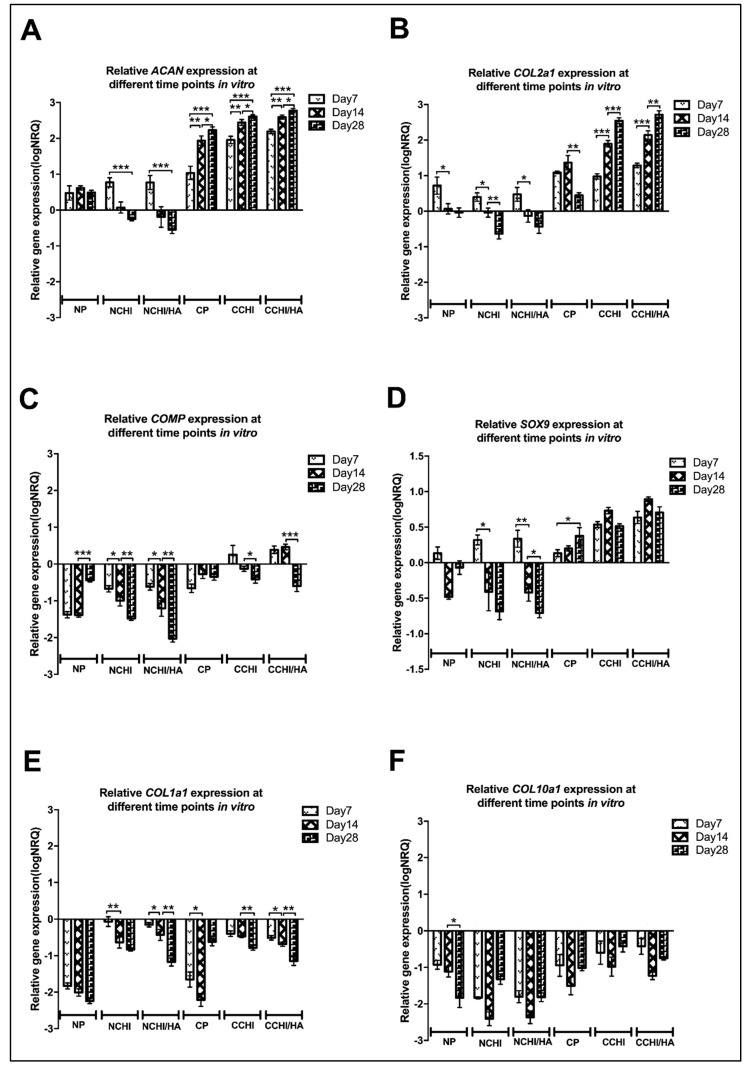
Figure 7.
Relative quantitative gene expression of (A) ACAN, (B) COL2A1, (C) COMP, (D) SOX9, (E) COL1A1, and (F) COL10A1 in different culture groups (N = normal medium; C = chondrogenic medium, P = 3D Pellet; CHI = chitosan scaffolds, CHI/HA= chitosan with hyaluronic acid scaffold) at different time points (Day 7, 14, and 28) (* p < 0.05, ** p < 0.01, *** p < 0.001). The baseline 0 represents untreated hADSCs in the monolayer, which was the normalization factor.

