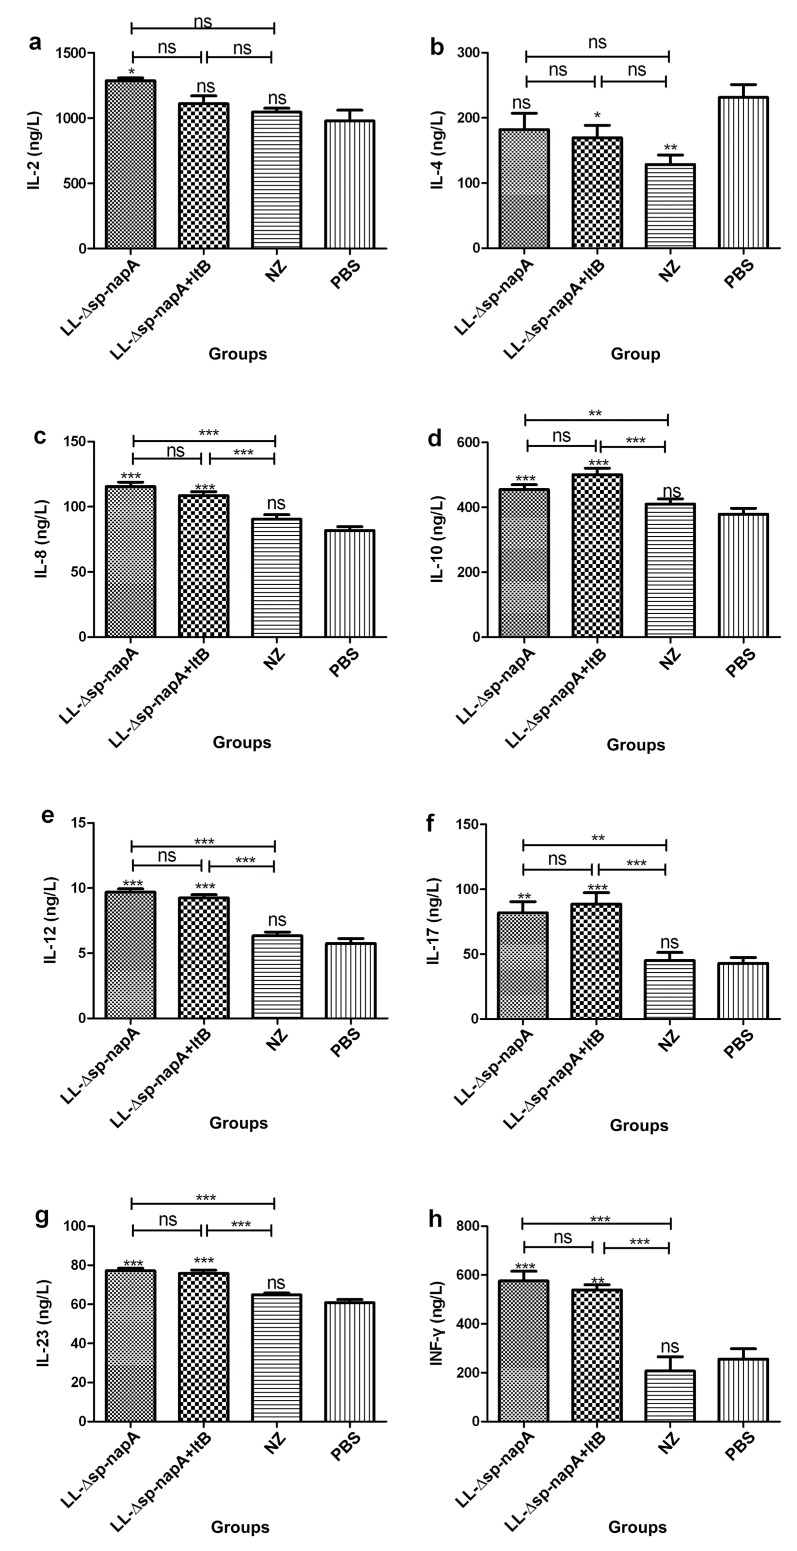
Figure 4.
Cytokine expression levels of in vitro cultivated splenocytes (a–h). Splenocytes were separated from the mice one weeks post immunization, and cultivated and stimulated with H. pylori cellular lysates for 3 days. The cytokines in the culture supernatant was measured using ELISA with three replicates. Data were expressed as mean ± SEM. Error bars indicate standard deviations. NZ-Δsp-napA, NZ-Δsp-napA+ltB, NZ and PBS groups, n = 6 each group; ns: no significance, p ≥ 0.05; *, **, ***: p < 0.05, p < 0.01, p < 0.001, respectively, compared with the PBS or designated group.

