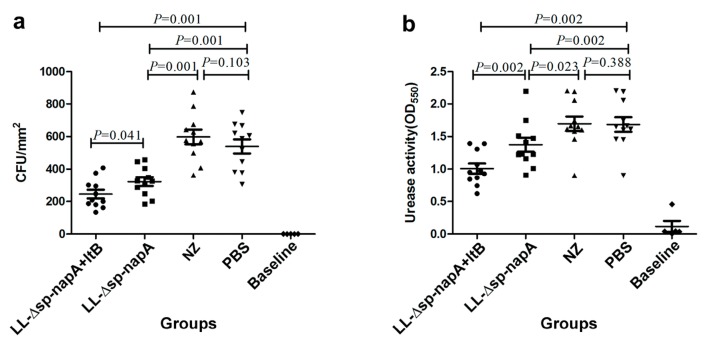
Figure 5.
Assessment of H. pylori colonization and histological change in the stomachs. The gastric tissues of mice were examined in the first week after H. pylori challenges. (a) Gastric H. pylori colonization levels assayed via bacterial cultivation. (b) Gastric bacterial burden evaluated using the urease tests. (c) Comparison of the groups on severity of gastric inflammatory changes. Data were expressed as mean ± SEM. Error bars indicate standard deviations. NZ-Δsp-napA, NZ-Δsp-napA+ltB, NZ and PBS groups (n = 11 each) were gavages with NZ3900/pNZ-Δsp-napA, mixture of NZ3900/pNZ-Δsp-napA and NZ3900/pNZ-sp-ltB, NZ3900/pNZ8110 and PBS, respectively, and challenged with H. pylori. No gavages were performed on Baseline group (n = 10). Ns: no significance; *: p < 0.05, Fisher’s LSD test, compared with the PBS or designated group.

