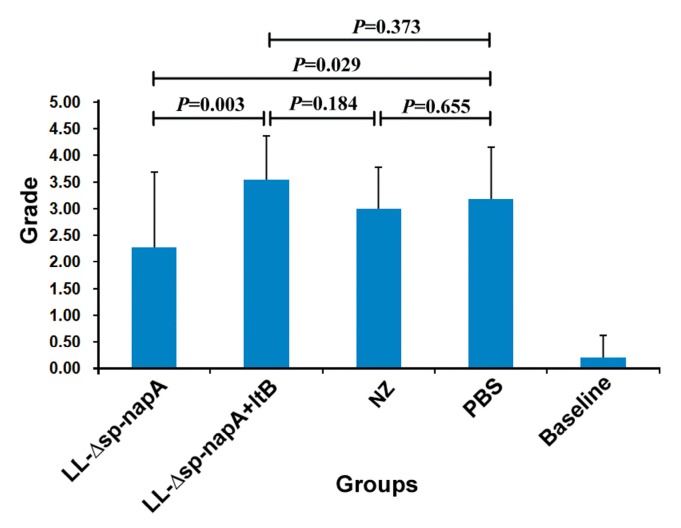
Figure 8.
Comparison of the groups on severity of gastric inflammatory changes. Gastric inflammatory changes of the mice were graded using the reported method [25,31]. Data were expressed as mean ± SEM. Error bars indicate standard deviations. NZ-Δsp-napA, NZ-Δsp-napA+ltB, NZ and PBS groups (n = 11 each) were gavages with NZ3900/pNZ-Δsp-napA, mixture of NZ3900/pNZ-Δsp-napA and NZ3900/pNZ-sp-ltB, NZ3900/pNZ8110 and PBS, respectively, and challenged with H. pylori. No gavages were performed on Baseline group (n = 10). Fisher’s LSD test, compared with the PBS or designated group.

