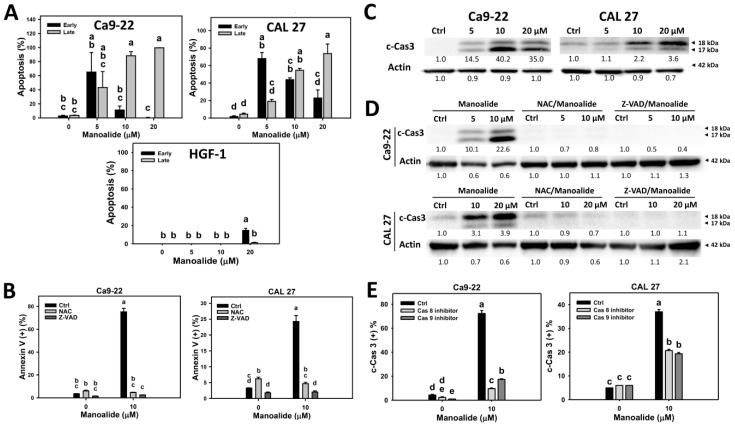
Figure 3.
Apoptosis changes in manoalide-treated oral cancer (Ca9-22 and CAL 27) cells and normal oral (HGF-1) cells. (A) Statistical results of the annexin V/7AAD method in manoalide-treated oral cancer cells and normal oral (HGF-1) cells in Figure S3A. Cells were treated with different concentrations of manoalide for 24 h. Early and late apoptosis were, respectively, counted by the populations in the annexin V (+)/7AAD (−) and annexin V (+)/7AAD (+) regions, i.e., Q3 and Q2. (B) Statistics results of annexin V/7AAD method in NAC, Z-VAD, and/or manoalide-treated oral cells in Figure S3B. Cells were pretreated with NAC (8 mM, 1 h) or Z-VAD (100 μM, 2 h), and posttreated with manoalide (10 μM, 24 h). Apoptosis was represented by the sum of early and late apoptosis, i.e., annexin V (+)/7AAD (+ or −). (C) Western blotting for detecting apoptosis in manoalide-treated oral cancer cells. (D) Western blotting for detecting apoptosis in NAC, Z-VAD, and/or manoalide-treated oral cells. Cleaved forms caspase 3 (c-Cas 3) were used to detect apoptosis. Actin was the internal control. (E) Statistical results of c-Cas 3 positive levels in Cas 8 inhibitor, Cas 9 inhibitor, and/or manoalide-treated oral cells in Figure S6. Cells were pretreated with Cas 8 inhibitor Z-IETD-FMK (100 μM, 2 h) or Cas 9 inhibitor Z-LEHD-FMK (100 μM, 2 h), and posttreated with manoalide (10 μM, 24 h). Data were analyzed by one-way ANOVA with Tukey HSD Post Hoc Test. Data, means ± SDs (n = 3). Data showing no overlapping same small letters represent significant difference (p < 0.05–0.001).

