Figure 4.
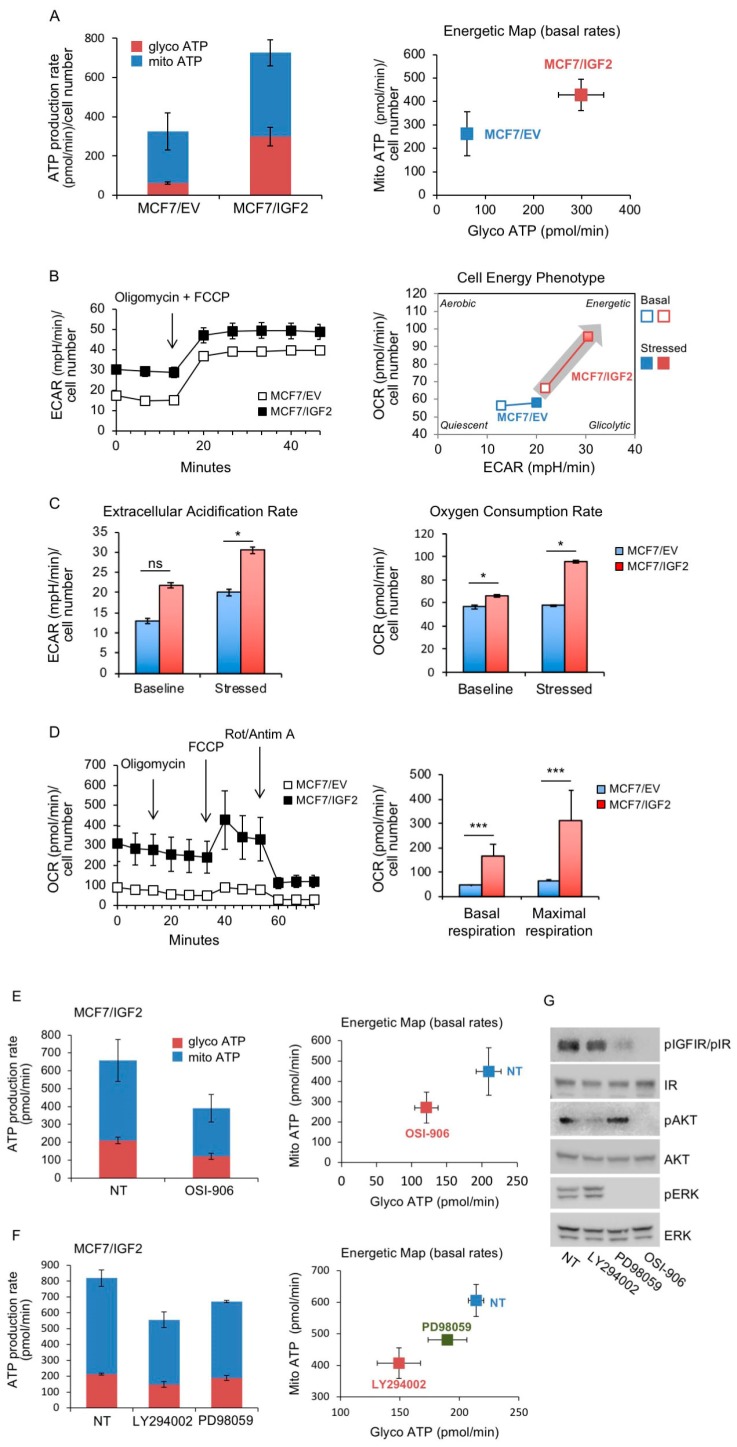
MCF7/IGF2 cells display increased ATP production both by glycolysis and oxidative phosphorylation (OxPhos). (A) ATP production rate in MCF7/IGF2 cells: the glycolytic ATP (glycoATP) and the mitochondrial (mitoATP) production rates were evaluated in MCF7/IGF2 cells as compared with MCF7/EV cells. Oxygen consumption rates (OCR) and extracellular acidification rates (ECAR) were first measured in basal conditions. Injection of oligomycin resulted in inhibition of mitochondrial ATP synthesis and decrease in OCR, allowing the mitoATP production rate to be quantified. Complete inhibition of mitochondrial respiration with rotenone plus antimycin A allowed accounting for mitochondrial-associated acidification and calculation of the glycoATP production rate according to the manufacturer instructions (Agilent ATP test). The histogram presented (left panel) and the energetic map (right panel) show the mean and range from two independent experiments. (B) Basal and stressed ECAR in MCF7/IGF2 cells in comparison to EV control cells. The simultaneous injection of oligomycin and carbonyl cyanide-4 (trifluoromethoxy) phenyldrazone (FCCP) caused a compensatory increase in the rate of glycolysis and drove the OCR higher as the mitochondria attempted to restore the mitochondrial membrane potential (Agilent phenotype test). (C) ECAR and OCR under basal and stressed conditions of cells treated as indicated in (B). Data presented are the mean and range from two independent experiments. (D) OCR was measured in MCF7/IGF2 cells and control cells by the XF cell mito stress test. Injections of respiration modulators including oligomycin, FCCP, rotenone and antimycin A were used to calculate key parameters of mitochondrial function (basal and maximal respiration are shown in the graph on the right). (E, F) Real time cell bioenergetics (Agilent ATP test) of MCF7/IGF2 cells was investigated in cells untreated (NT) and after exposure to the dual IR/IGF1R TK inhibitor OSI-906 (E), or the PI3K inhibitor LY294002 or the MEK1 inhibitor PD98059 (F). (G) Western blot analysis confirmed the effects of the inhibitors on pIGF1R/pIR, pAKT and pERK. (D–G) Values are means ± SEM of three independent experiments. (ns, not significant; * p < 0.05; *** p < 0.001).

