Figure 5.
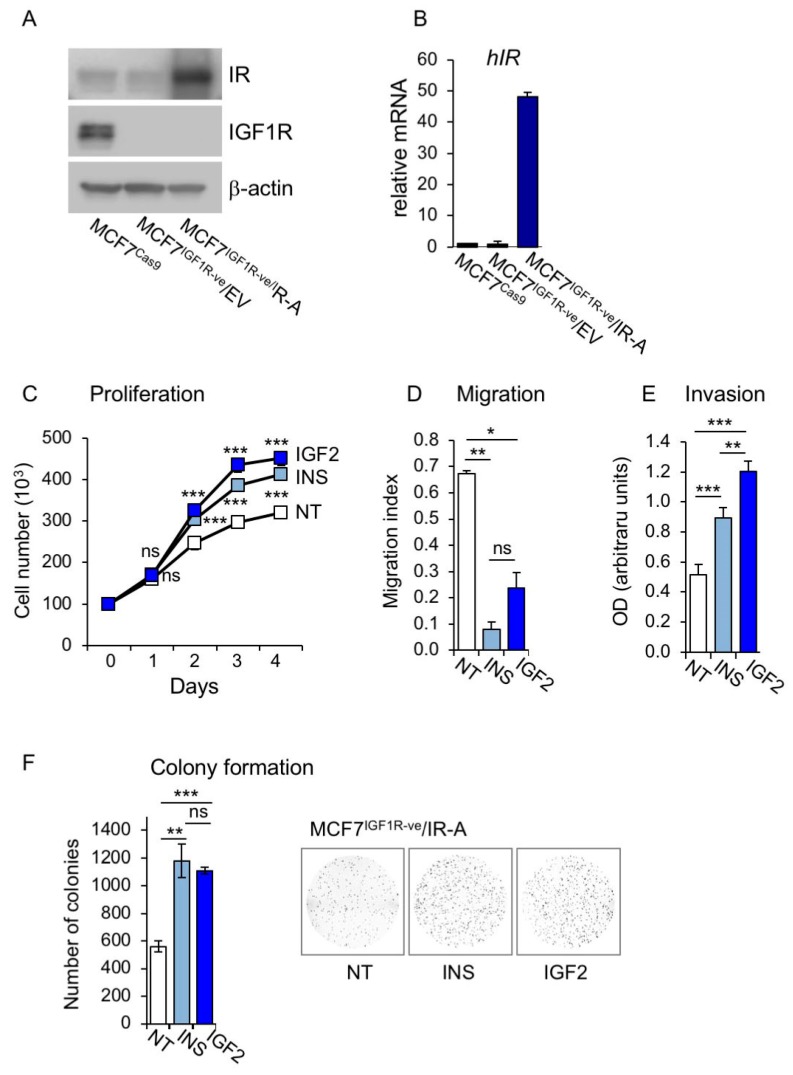
Characteristics and biological behavior of MCF7IGF1R-ve/insulin receptor isoform A (IR-A) cells. (A) MCF7IGF1R-ve/IR-A, control MCF7IGF1R-ve/EV cells and parental MCF7/CRISPR associated protein 9 (Cas9) cells were grown in 10% FBS, lysed and analyzed by SDS-PAGE and immunoblot for IR and IGF1R expression. (B) The same cells as in (A) were then analyzed for IR expression by qRT-PCR using human β-actin as the housekeeping control gene for normalization. Results are shown as means ± SE of three independent experiments. (C) Cell proliferation. MCF7IGF1R-ve/IR-A cells were cultured in the absence (NT) or presence of 10 nM of insulin or IGF2, and cell number measured by trypan blue exclusion assay at different time points, as indicated. (D) Cell migration was measured in a wound healing assay. MCF7IGF1R-ve/IR-A cells were seeded in six-well plates and allowed to reach confluence. After 24 h, we generated wounds in the confluent monolayers and incubation in serum free medium was continued for further 24 h in the absence (NT) or presence of 10 nM insulin or IGF2. Randomly chosen wound fields were photographed under a microscope every 8h for 24 h. The histogram represents the mean of the migration index calculated as follows: wound area after the indicated period/initial wound area. Representative fields are shown in the right panels. Experiments were performed in triplicates and data calculated as means ± SEM. Statistical significance of differences was analyzed using the Student’s t test. (E) Cell invasion. Serum starved MCF7IGF1R-ve/IR-A cells seeded on polycarbonate filters coated with 25 µg/mL fibronectin were then allowed to migrate for 6 h to the lower chamber in the absence (NT) or presence of 10 nM of insulin or IGF2. Values are means ± SEM of three independent experiments done in duplicate. (F) Colony formation. MCF7IGF1R-ve/IR-A cells were seeded in soft-agar and grown in serum free medium for three weeks in the absence (NT) or presence of 10 nM of insulin or IGF2. Colonies were stained with MTT and then photographed. The histogram on the right represents the number of colonies (means and range). Data shown are from two independent experiments run in quadruplicate wells. (ns, not significant; * p < 0.05; ** p < 0.01; *** p < 0.001).

