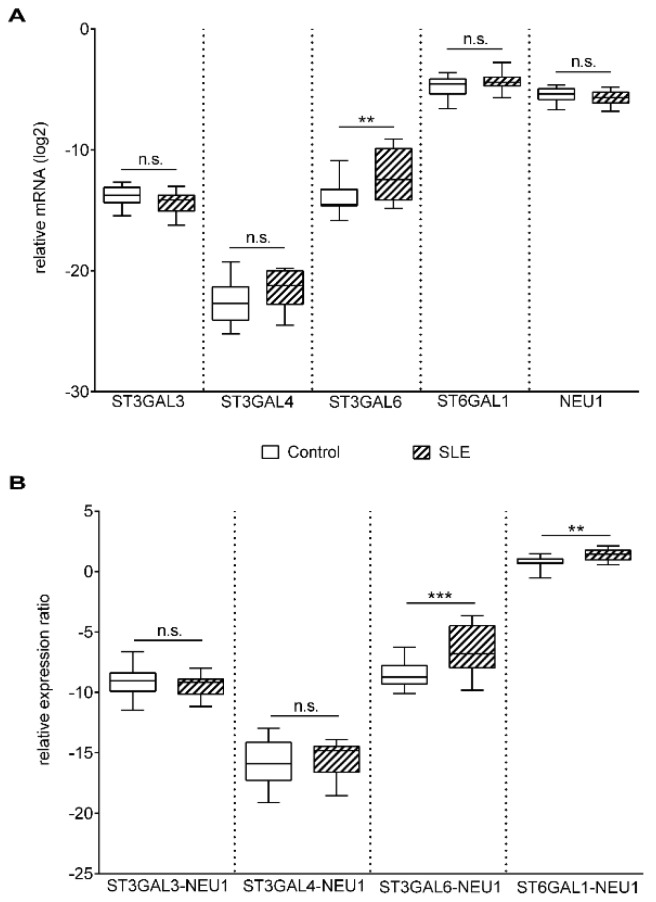
Figure 3.
Gene expression of sialyltransferases (ST) and neuraminidase-1 (NEU1) in activated T cells. Total RNA was extracted from activated T cells and mRNA expression levels were analyzed by qPCR. (A) Results of the relative expression were normalized to the expression levels of RPL27 housekeeping gene (log2 transformation, ΔCt). Gene names and primer sequences are listed in Table 2 and Table 4, respectively. (B) ST/NEU1 mRNA expression ratios. The sialyltransferase-neuraminidase mRNA expression ratios of individual persons were calculated as follows: ΔCt ST/ΔCtNEU1. Upper and lower quartiles and whiskers of boxes extend to the minimum and maximum values, and the band inside the box is the median. Statistical analysis was performed using an unpaired Student t-test, where ** p< 0.01; *** p< 0.001. SLE: n = 18, and healthy controls: n = 19.

