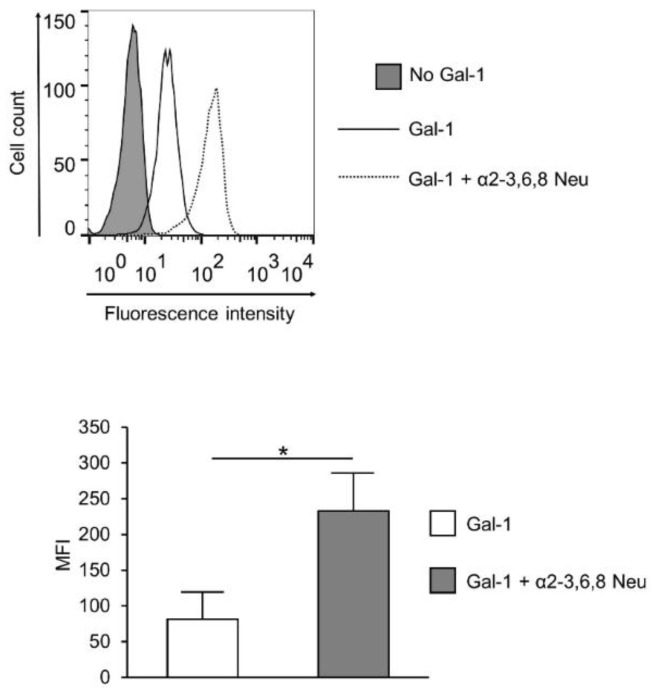
Figure 4.
Effect of neuraminidase treatment on Gal-1 binding of SLE T cells. Activated SLE T cells were treated with α2-3,6,8 neuraminidase (Gal-1 + α2-3,6,8 Neu; dotted line) or left untreated (Gal-1; empty, continuous line), and then Gal-1 binding was investigated by cytofluorimetry, as described in the materials and methods section. The grey shadowed histogram shows the negative control: no Gal-1, +streptavidin—FITC. The upper image shows a representative profile of Gal-1 binding, the lower graph shows means (±SEM) of the mean fluorescence intensity (MFI) values of activated SLE T cells. Statistical analysis was performed using a two-tailed paired t-test. * p < 0.05, n = 3.

