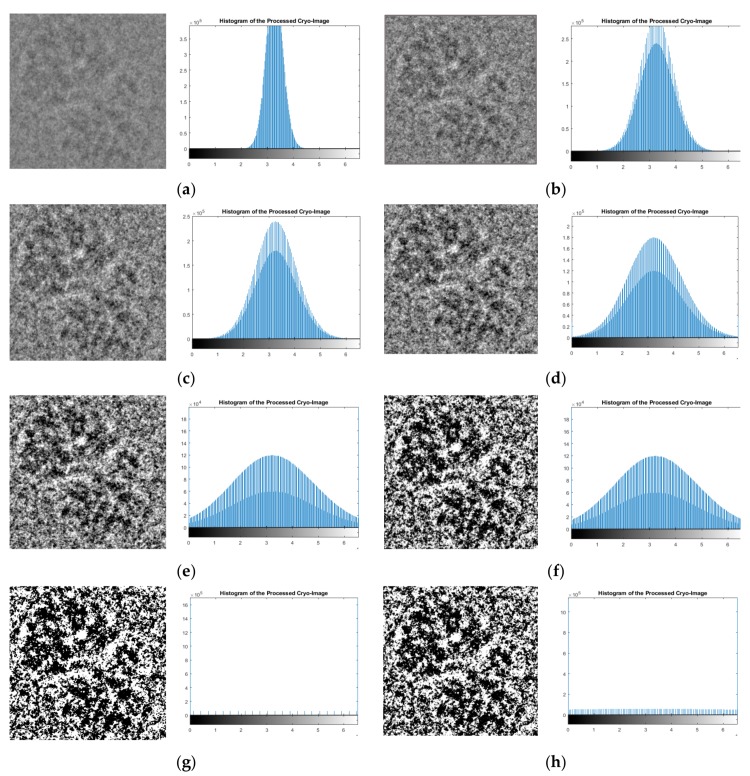
Figure 3.
One zoomed-in particle image from the ribosome dataset [28] during the first stage of the pre-processing “intensity adjustment” using different scaling factors in the EMAN2 [29]. (a) Original zoomed-in particle (manually selected and cropped from the original image) and the original histogram of the image; (b) particle image after intensity adjustment using scale factor 5 and the histogram of the pre-processed image; (c) particle image after intensity adjustment with scale factor 4 and the histogram of the pre-processed image; (d) particle image after the intensity adjustment with scale factor 3 and the histogram of the pre-processed image; (e) particle after intensity adjustment with scale factor 1 and the histogram of the pre-processed image; (f) particle image after intensity adjustment with scale factor 0.1 and the histogram of the pre-processed image; (g) particle image after intensity adjustment with scale factor 0.25 and the histogram of the pre-processed; (h) particle image after intensity adjustment with scale factor 0.5 and the histogram of the pre-processed image.

