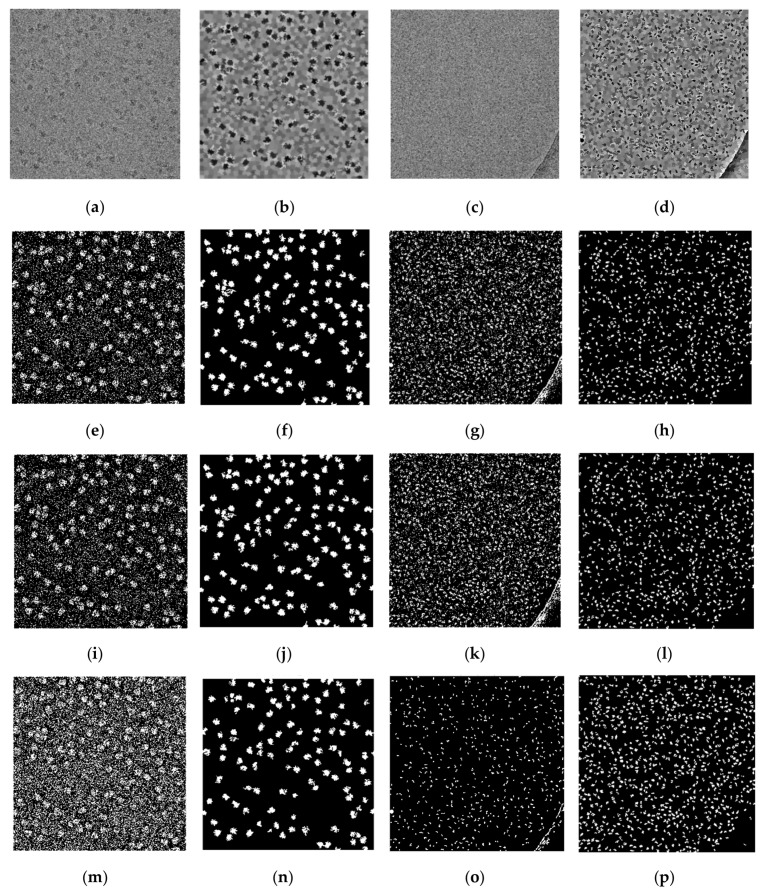
Figure 8.
Cryo-EM super-clustering results of SP-k-means, SP-FCM, and SP-IBC in comparison with the base algorithms. (a) An original cryo-EM image of the ribosome [28]; (b) intermediate micrograph generated by SLIC from pre-processed image of the ribosome [28]; (c) original cryo-EM image of beta-galactosidase [30]; (d) intermediate micrograph generated by SLIC for beta-galactosidase [30]; (e) k-means clustering results of the ribosome [28]; (f) SP-k-means clustering results of the ribosome [28]; (g) k-means clustering results of beta-galactosidase [30] cryo-EM image; (h) SP-K-means clustering results of beta-galactosidase [30] cryo-EM image; (i) FCM clustering results of the ribosome [28] cryo-EM image; (j) SP-FCM clustering results of the ribosome cryo-EM image; (k) FCM clustering results of the beta-galactosidase cryo-EM image; (l) SP-FCM clustering results of the beta-galactosidase [30] cryo-EM image; (m) IBC clustering results of the ribosome [28] cryo-EM image; (n) SP-IBC clustering results of the ribosome [28] cryo-EM image; (o) IBC clustering results of the beta-galactosidase [30] cryo-EM image; (p) SP-IBC clustering results of the beta-galactosidase [30] cryo-EM image.

