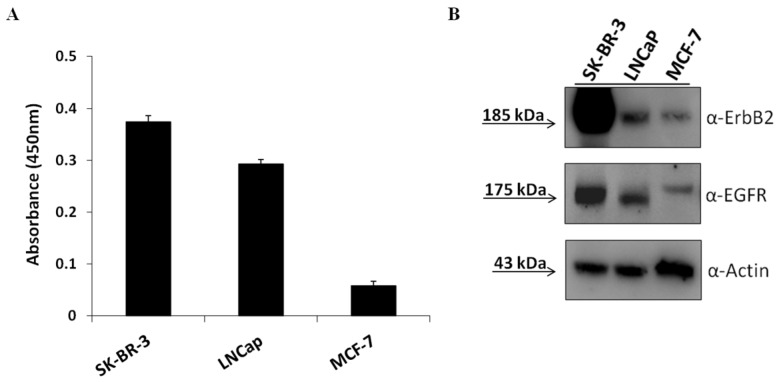
Figure 2.
Expression of ErbB2, EGFR, and PD-L1 on tumor cell lines. Cell ELISA assay with a commercial anti-PD-L1 antibody on SK-BR-3, LNCaP, and MCF-7 tumor cells (A) for detection of cell surface PD-L1 expression. Western blotting analyses with the commercial anti-ErbB2 and anti-EGFR mAbs of extracts from SK-BR-3, LNCaP, and MCF-7cells. The intensity of the bands was normalized to actin (B). The ratios of ErbB2/actin and EGFR/actin signal intensities were calculated for each cell extract and found to be about 30 and 5 for SK-BR-3, 2 and 3 for LNCaP and 0.2 and 0.3 for MCF-7, respectively.

