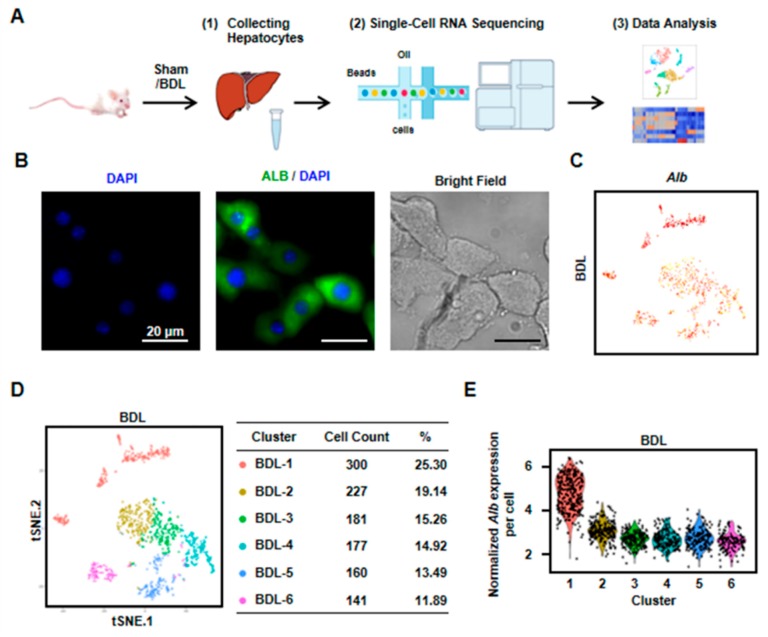
Figure 1.
Six clusters were classified of cholestatic hepatocytes depending on scRNA-seq analysis. (A) Workflow depicts isolation of hepatocytes from liver for generating scRNA transcriptome profiles. (B) The staining of albumin (Alb) on isolated cholestatic hepatocyte smear. Scale bars, 20 μm. (C) The expressions of Alb in all cells were shown. (D) 2D visualization of single-cell clustering of hepatocytes profiles inferred from RNA-seq data. Six major classes of hepatocytes in injured liver were detected. The count of each cell population was indicated. Colored bar coded as indicated. (E) The expression of Alb in each cluster was shown.

