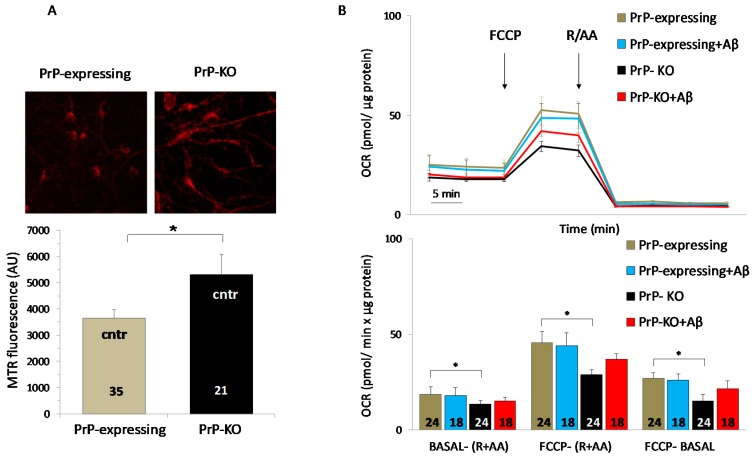
Figure 3.
PrPC controls mitochondrial oxygen consumption rate so as to reduce ROS production. (A) Higher quantities of reactive oxygen species (ROS) are present in mitochondria of control PrP-KO cortical neurons compared to the PrP-expressing counterparts. This is evident from both the upper panel, showing representative fluorescence micrographs of neurons loaded (30 min, 37 °C) with the ROS-sensitive mitochondrial matrix-accumulating cationic probe MitoTracker Red (MTR, 50 nM (λexc = 579 nm, λem = 599 nm), Molecular Probes), and the lower bar diagram reporting the corresponding MTR fluorescence quantification. Coverslip images were collected using an inverted microscope (Olympus IMT-2) equipped with a Xenon lamp, a 40× oil-immersion objective, appropriate excitation and emission filters and a cooled 16-bit digital CCD camera (Micromax, Princeton Instruments). Following the selection of mitochondria-rich fields in each coverslip, their mean MTR fluorescence was calculated after subtracting the background fluorescence collected in dark fields. (B) Compared to PrP-expressing neurons (grey), PrP-KO neurons (black) have a reduced oxygen consumption rate (OCR), as both OCR representative traces (upper panel), and their quantification (lower panel), indicate. Quantification of basal (BASAL-(R + AA)) and maximal (FCCP-(R + AA)) OCR values were calculated by subtracting non-mitochondrial OCR value, obtained after adding mitochondrial respiration blockers antimycin A (AA) and rotenone (R), from the OCR measured, respectively, before and after addition of the respiration uncoupler carbonyl cyanide 4-(trifluoromethoxy)phenylhydrazone (FCCP). Mitochondrial spare respiratory capacity (FCCP-BASAL) was calculated by subtracting the basal OCR value from the maximal OCR value. These results suggest that the slower electron flow by mitochondria of PrP-KO neurons renders more reduced the redox centers of the respiratory chain complexes of these cells, favoring the supply of electrons to oxygen and the production of superoxide anion radicals. However, Aβ-addition does not significantly alter the OCR in either PrP-expressing (light blue) and PrP-KO (red) neurons. For these measurements, neurons were isolated and plated onto XF24 microplate wells (Agilent) for seven days, at the end of which they were treated, or not, with Aβ1-42 oligomers. OCR values were real-time assessed with the XF24 Extracellular Flux Analyzer (Agilent), which allows to measure OCR changes after the sequential addition of FCCP (0.5 µM), and antimycin A (1 µM) plus rotenone (1 µM) together. Results were normalized to the protein content determined by a commercial kit (Total Protein Kit, micro Lowry, Peterson′s modification, Sigma). * p < 0.05 (Student′s t-test). Other details are as in the legend to Figure 1 and Figure 2.

