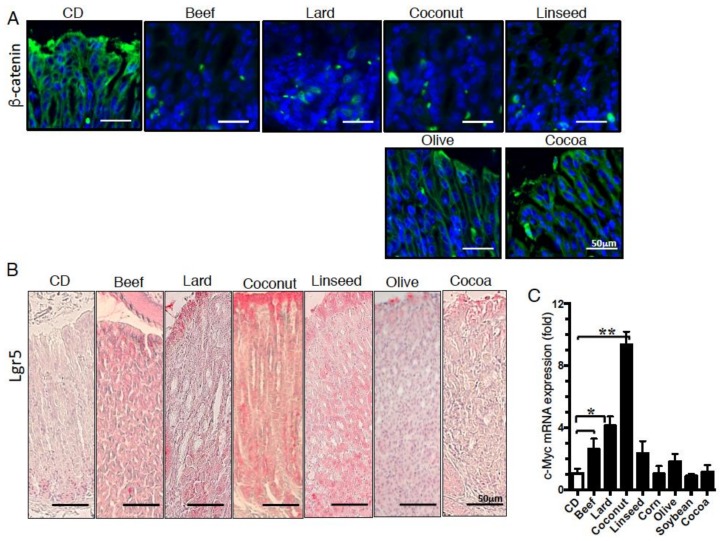
Figure 6.
Difference in the intracellular and nuclear localization of β-catenin and the expression of β-catenin target molecules in the gastric mucosa of HFD-fed mice. Staining of the gastric mucosa with (A) β-catenin and (B) Lgr5 of mice fed experimental diets for 12 weeks. (C) mRNA expression of c-Myc of the gastric mucosa in mice fed experimental diets for 12 weeks. Data, shown as mean ± SD were analyzed by the one-way ANOVA followed by Holm-Sidak post-hoc test for multiple comparisons. * p < 0.05, ** p < 0.001. Eight mice per group were used.

