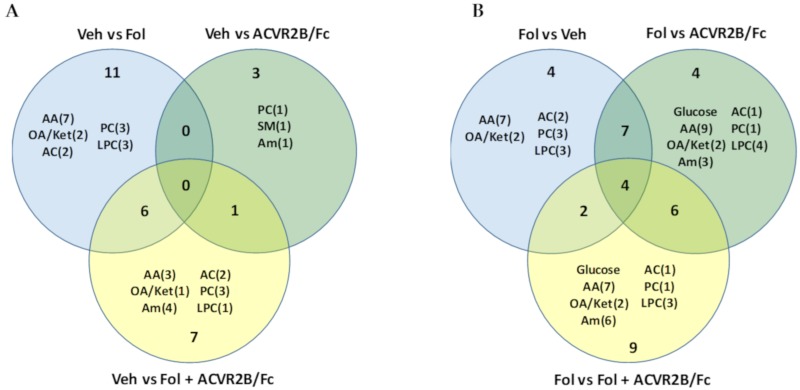
Figure 7.
(A) Venn diagram of the differences in the muscle tissue extact metabolome between the vehicle treated group and the other three groups. Annotations inside each circle indicate the number of metabolites in different chemical classes that make up the differences. (B) Venn diagram of the differences between the Folfiri treated group and the other groups. AA, amino acids; OA/Ket, organic acids and ketones; Am, amines; AC, acylcarnitines; PC, glycerophosphcholines, LPC, lysophosphocholines; SM, sphingomyelines.

