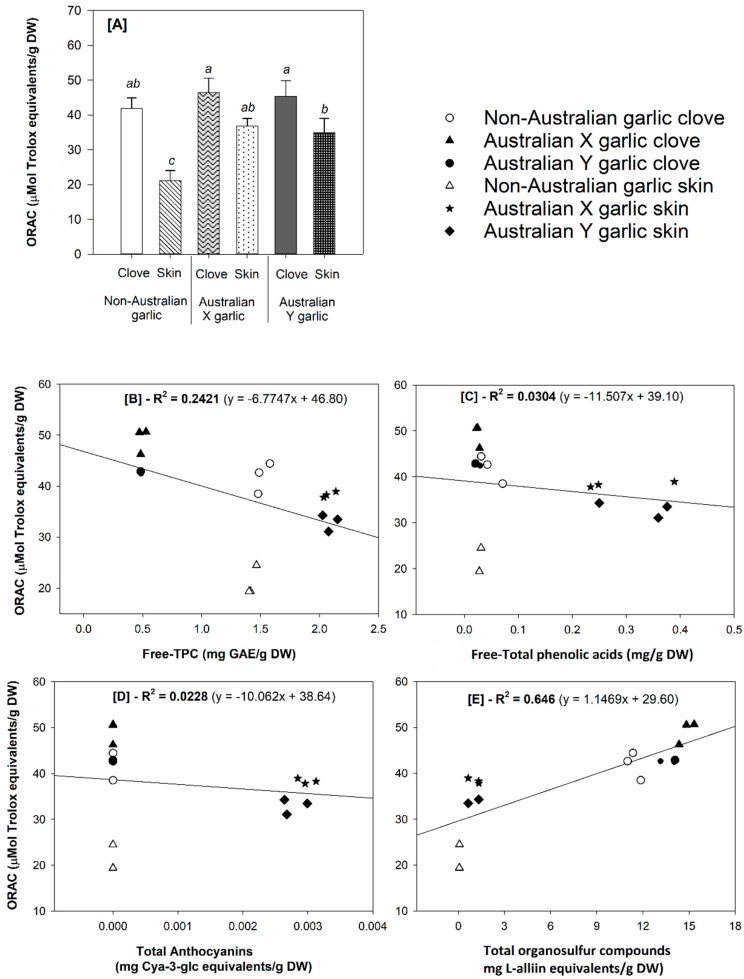
Figure 3.
(A) Antioxidant capacity (Oxygen radical absorbance capacity—ORAC) and correlation between ORAC values and the determined (free) phytochemicals in the analyzed garlic samples: [B] ORAC vs. free total phenolic content (TPC), [C] ORAC vs. free total phenolic acids, [D] ORAC vs. total anthocyanins, and [E] ORAC vs. total organosulfur compounds. Different letters in Figure A indicate significant differences in antioxidant capacity among the samples tested at α = 0.05 (n = 3).

