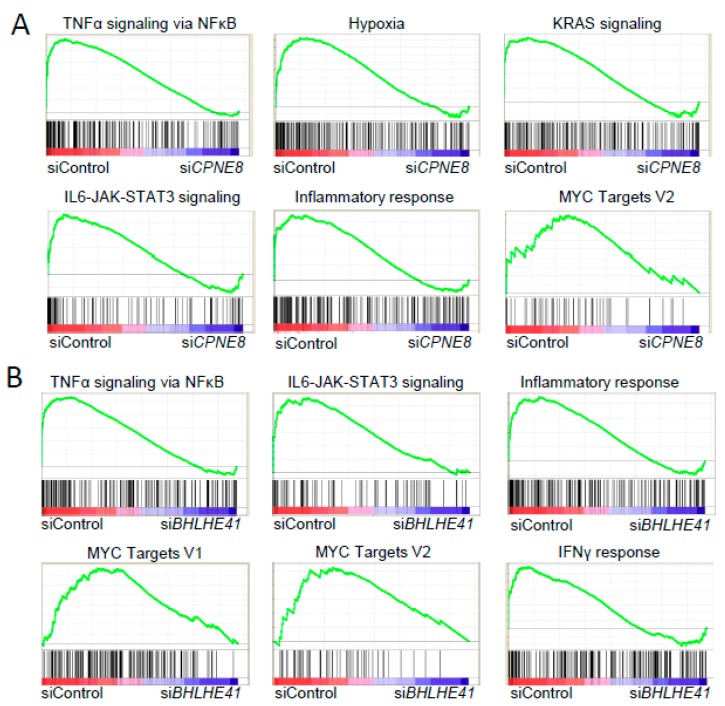
Figure 5.
Enriched pathways observed with siRNAs targeting CPNE8 and BHLHE41. (A) Gene Set Enrichment Analysis (GSEA) enrichment plot of microarray analysis of RMG1 cells in siControl versus CPNE8-specific siRNAs. (B) GSEA enrichment plot of microarray analysis of OVCAR3 cells in siControl versus BHLHE41-specific siRNAs. The X and Y axes represent “rank in ordered dataset” and “enrichment score”, respectively.

