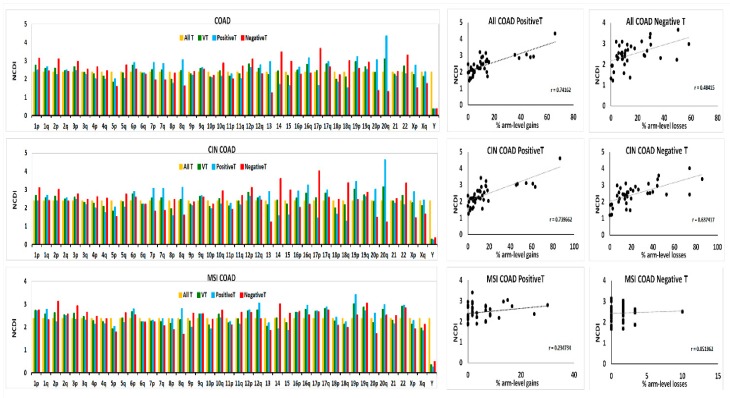
Figure 2.
Percentage chromosomal distribution, expressed as NCDI (Normalized Chromosomal Distribution Index—see formula in Materials and Methods), of chromosomal density (number of specific transcripts divided by the total number of transcripts in that chromosome or chromosomal arm) of Variable Transcripts (VT), PositiveT and NegativeT. Values obtained for all transcripts (All T) located in a chromosome or chromosomal arm are also reported for comparison. Results obtained in COAD, CIN COAD and MSI COAD samples are shown in the left panels. Correlation plots of the NCDI values of PositiveT and NegativeT with the frequencies of arm-level gains and losses in each sample group are reported in the right panels. The Pearson’s r index is reported in each correlation plot.

