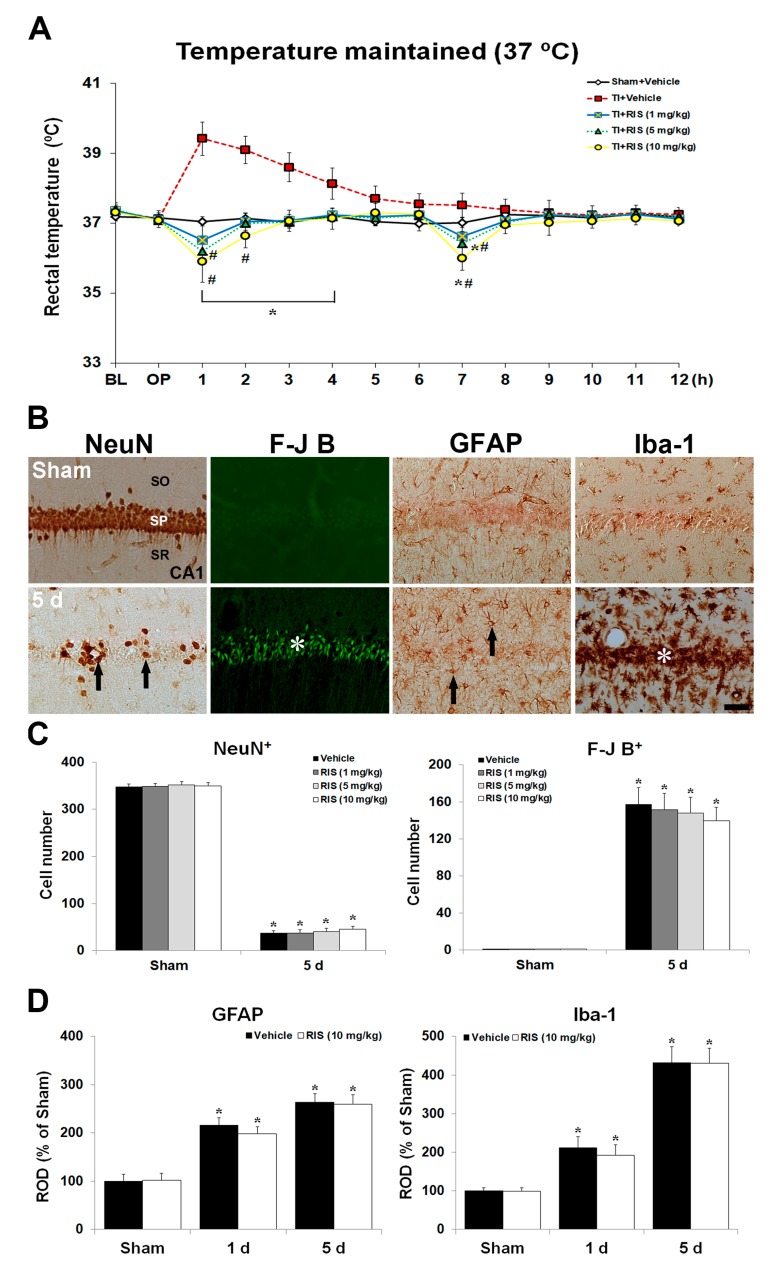
Figure 3.
Effects of RIS against TI injury under controlled body temperature (CBT) condition. (A) Changes in body temperature under CBT condition for 12 h after TI. Body temperature is slightly low in the TI + 10 mg/kg RIS group compared to the TI + 5 mg/kg RIS group. White arrows indicate times of RIS treatment. The bars indicate the means ± SEM, n = 7/group, two-way analysis of variance (ANOVA) with a post-hoc Bonferroni’s multiple comparison test (* p < 0.05 vs. sham + vehicle group; # p < 0.05 vs. TI + vehicle group). (B) Effect of RIS (10 mg/kg) on NeuN+, F-J B+, GFAP+, and Iba-1+ cells in the CA1 under CBT after TI 5 days after TI. In the TI + RIS group, a few NeuN+ neurons (arrows) and many F-J B+ cells (asterisks) are shown in the stratum pyramidale (SP) at 5 days after TI. GFAP+ astrocytes (arrows) and Iba-1+ microglia (asterisks) are markedly increased in the TI + RIS group under CBT 5 days after TI. SO, stratum oriens; SP, stratum pyramidale; SR, stratum radiatum. Scale bar = 50 μm. Quantitative analyses of NeuN+ and F-J B+ cells (C), and GFAP+ and Iba-1+ cells (D). The bars indicate the means ± SEM, n = 7/group, two-way analysis of variance (ANOVA) with a post-hoc Bonferroni’s multiple comparison test (* p < 0.05 vs. sham + vehicle group).

