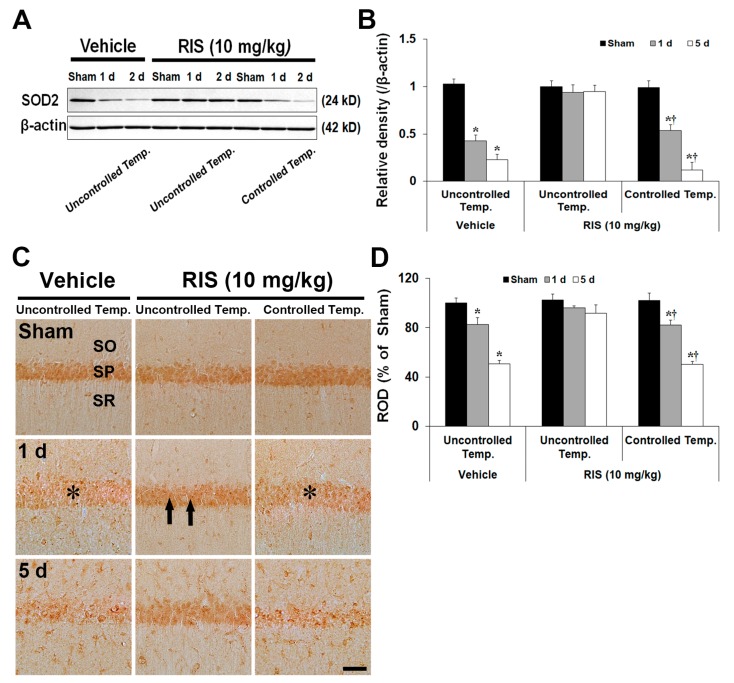
Figure 6.
Effects of RIS on levels and immunoreactivity of SOD2 protein after TI under UBT and CBT conditions. (A) Western blot analysis of SOD2 protein in the hippocampus after TI under UBT and CBT conditions. Note that SOD2 levels are maintained in the TI + RIS group under UBT after TI. (B) Quantitative analysis of SOD2 protein in the hippocampus. Protein expression is normalized to β-actin. The bars indicate the means ± SEM, n = 7/group, two-way analysis of variance (ANOVA) with a post-hoc Bonferroni’s multiple comparison test (* p < 0.05 vs. sham + vehicle group under UBT condition; † p < 0.05 vs. TI + RIS group under UBT condition). (C) Representative images of immunohistochemistry for SOD2 in the hippocampal CA1 after TI under UBT and CBT conditions. SOD2 immunoreactivity is significantly decreased in CA1 pyramidal neurons of the stratum pyramidale (SP, asterisks) in the TI + vehicle group under UBT and TI + RIS group under CBT at 1 day after TI; however, the immunoreactivity is maintained (arrows) in the TI + RIS group under UBT. SO, stratum oriens; SR, stratum radiatum. Scale bar = 50 μm. (D) Quantitative analysis of SOD2 immunoreactivity in CA1 pyramidal neurons. A ratio of ROD is calibrated as %, with the sham + vehicle group designated as 100%. The bars indicate the means ± SEM, n = 7/group, two-way analysis of variance (ANOVA) with a post-hoc Bonferroni’s multiple comparison test (* p < 0.05 vs. sham + vehicle group under UBT condition; † p < 0.05 vs. TI + RIS group under UBT condition).

