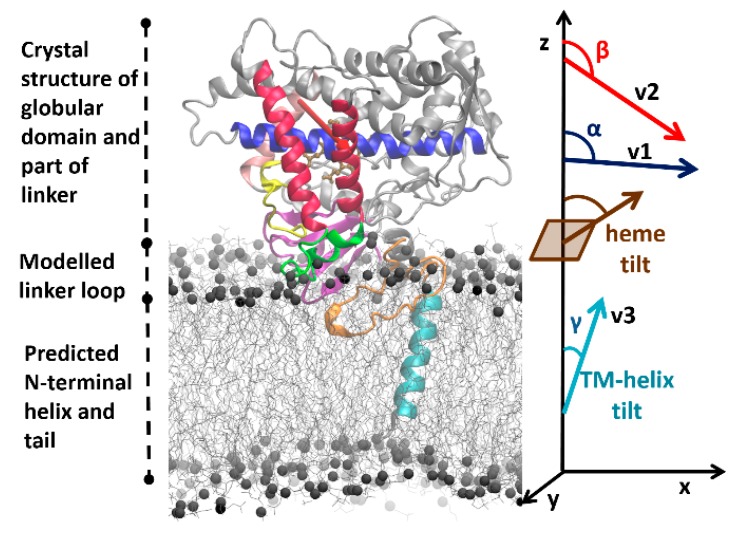
Figure 2.
Initial model of human cytochrome P450 (CYP) 2C9 showing its three domains and the initial information on which modeling and simulation of its arrangement in the phospholipid bilayer was based. The crystal structure (PDB 1R9O) of the globular domain (residues 50–490) and part of the linker region (residues 37–49) are shown in cartoon representation. Secondary structure predictions indicate the length of the N-terminal transmembrane (TM)-helix (cyan, residues 3–21). These two components are connected by a modeled linker loop of unknown conformation (orange, residues 22–36). The flexible C-terminal tail (residues 491–492) was not included in the model. The F’–G’ helices (residues 210–220) were not observed in the structure and were modeled from the crystal structure of CYP 2C19 (PDB 4GQS). Important secondary structure elements in the globular domain are colored as follows: β-strand region in magenta, F and G helices in red, I-helix in blue, B–C loop in yellow, and F’–G’ helices in green. The heme is shown in brown stick representation. Experimentally, it is known that the globular domain interacts with the bilayer (shown in grey line representation with grey spheres representing the phosphorous atoms) and, during the coarse-grained (CG) simulations, it approached and dipped into the bilayer. The heme tilt angle and the angles α and β defining its orientation in the bilayer are shown on the right, along with the definition of the TM-helix tilt angle (γ), and the vectors (v1 along the I-helix , v2 shown by the red arrow from the C to the F helix, and v3 along the TM-helix) computed to define these angles; the definitions of these angles are given in the Materials and Methods section.

