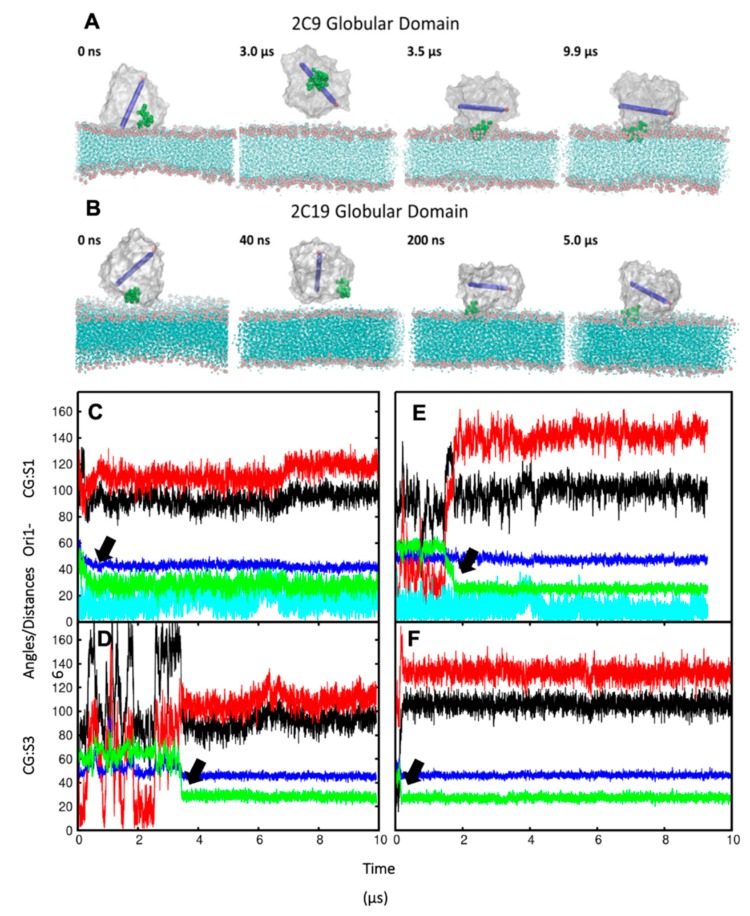
Figure 3.
(A,B) Snapshots from CG simulations of globular domains (S3) of (A) CYP 2C9 and (B) CYP2 C19 showing exploration of different orientations followed by convergence to the same orientation as observed for CG simulations of the full-length wild-type proteins. The globular domain is shown with a silver surface representation, with the F’–G’ helices shown as green VDW spheres and the I-helix (residues 286–316) shown as a blue cylinder with an arrow and a red sphere at the C-terminal end. The 1-palmitoyl-2-oleoyl-sn-glycero-3-phosphocholine (POPC) bilayer is shown in cyan, with the phosphate atoms in the head groups shown as red spheres. (C–F) Convergence of the orientation and position of the globular domain during CG simulations of CYP 2C9 (C,D) and CYP 2C19 (E,F). The angles (°) and distance (Å) values vs time (μs) are shown for selected trajectories from CG systems: (C,E) S1 (full-length proteins); (D,F) S3 (globular domain only). The angles α (black), β (red), and the TM-helix tilt angle (cyan) (defined in Figure 2 and Materials and Methods) are shown along with the axial distances of the bilayer CoM to the CoM of the globular domain (blue) and the F’–G’ helices (green). The thick black arrows point to the decrease in the distance of the F’–G’ helices from the membrane center, which is coincident with convergence to stable orientations.

