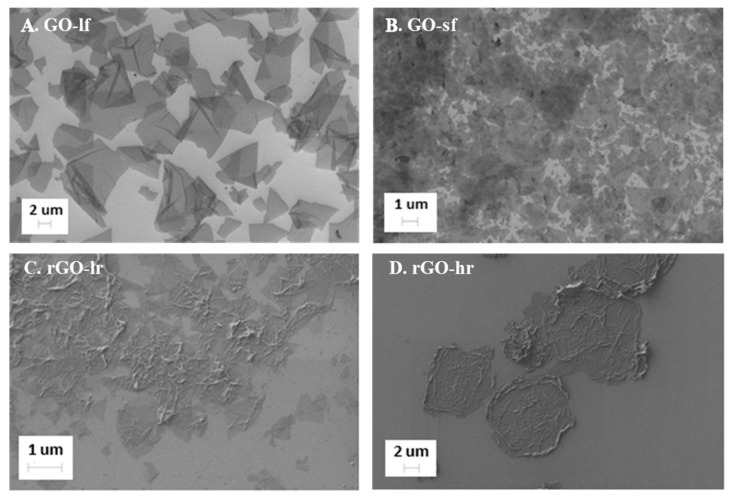
Figure 1.
SEM images of the graphene oxide (GO) with large flakes (GO-lf, panel A), GO with small flakes (GO-sf, panel B), reduced graphene oxide (rGO) with low reduction level (rGO-lr, panel C), and rGO with high reduction level (rGO-hr, panel D) placed on a Si substrate. Different sizes of the GO flakes (A,B) and the aggregation tendency of the rGO flakes, (C,D) are shown.

