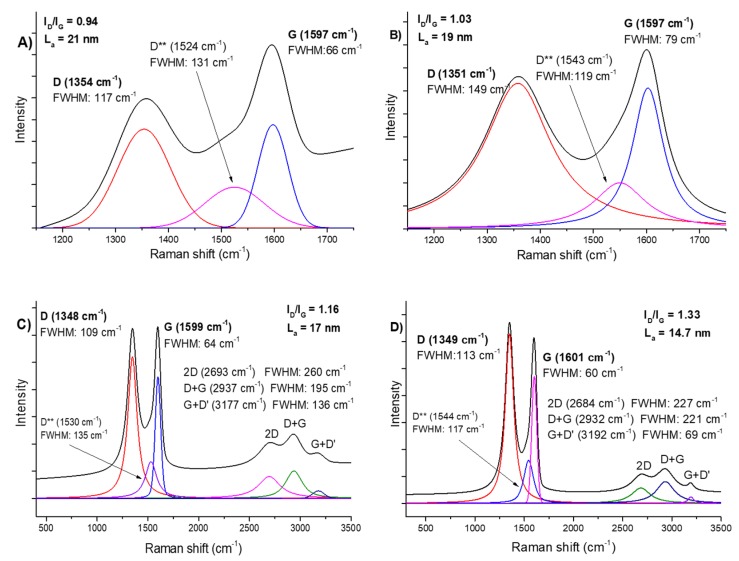
Figure 2.
Raman spectra of the GO-sf (A), GO-lf (B), rGO-lr (C), and rGO-hr (D) samples. Legend: GO-lf: graphene oxide with large flakes (10–20 µm), GO-sf: graphene oxide with small flakes (0.2–2 µm), rGO-lr: reduced graphene oxide with low reduction level, and rGO-hr: reduced graphene oxide with high reduction level. The black lines in spectra presented in the Figure 2 (A, B, C, D) correspond peak sums, the colored lines depict single mods. For example, in Figure 2A: the red line corresponds to peak D, the pink line peak D **, the blue line peak G.

