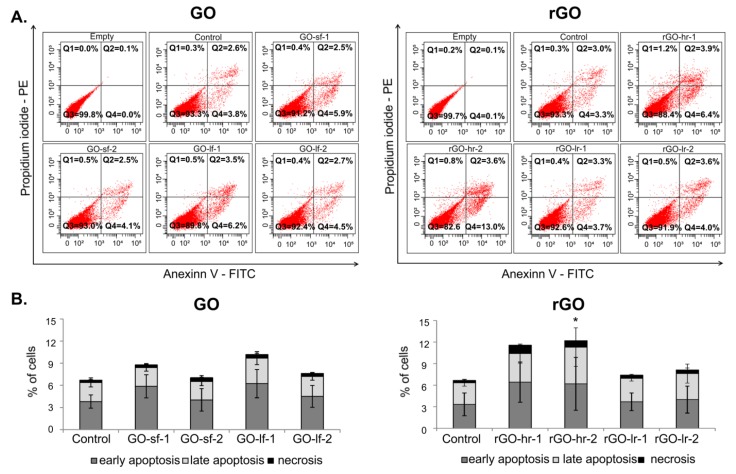
Figure 6.
Viability of the hUC-MSCs after 72 h of culture on the GO and rGO substrates. The quantification of cell viability was determined by the flow cytometric analysis of the apoptotic and necrotic cells via the double-staining of hUC-MSCs with Annexin V-FITC and propidium iodide. (A) Representative flow cytometric dot-plots are presented to demonstrate the morphology of hUC-MSCs and gating strategy for the determination of the percentages of live (Annexin V-negative and propidium iodide-negative; Q3), early apoptotic (Annexin V-positive and propidium iodide-negative; Q4), late apoptotic (Annexin V-positive and propidium iodide-positive; Q2), and necrotic (Annexin V-negative and propidium iodide-positive; Q1) cells. An unstained probe (empty) constituted the negative control. (B) The percentages of early apoptotic, late apoptotic, and necrotic cells were determined using the FACS Diva software. p Value less than 0.05 (p < 0.05) was considered statistically significant and labeled by an asterisk (*). Legend: GO-sf-1: small flakes/thick layer; GO-sf-2: small flakes/thin layer; GO-lf-1: large flakes/thick layer; GO-lf-2: large flakes/thin layer; rGO-hr-1: high reduction level/thin layer; rGO-hr-2: high reduction level/thick layer; rGO-lr-1: low reduction level/thin layer; rGO-lr-2: low reduction level/thick layer; Control: tissue culture plastic surface (TCPS).

