Figure 2.
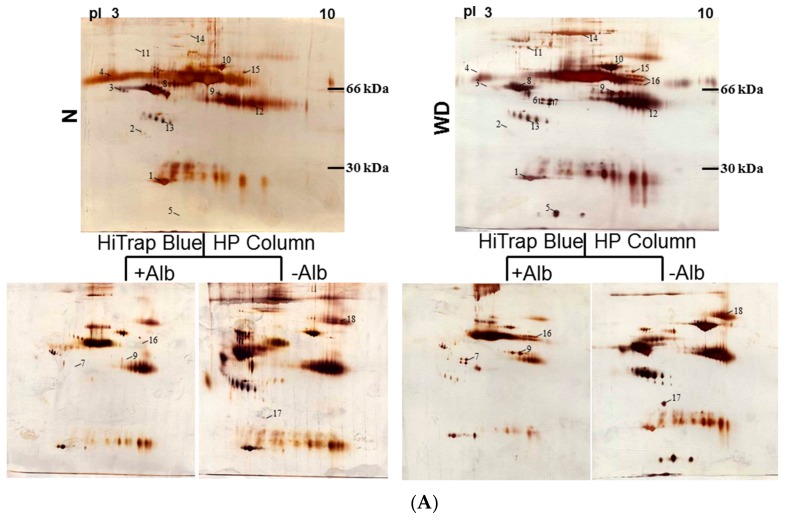
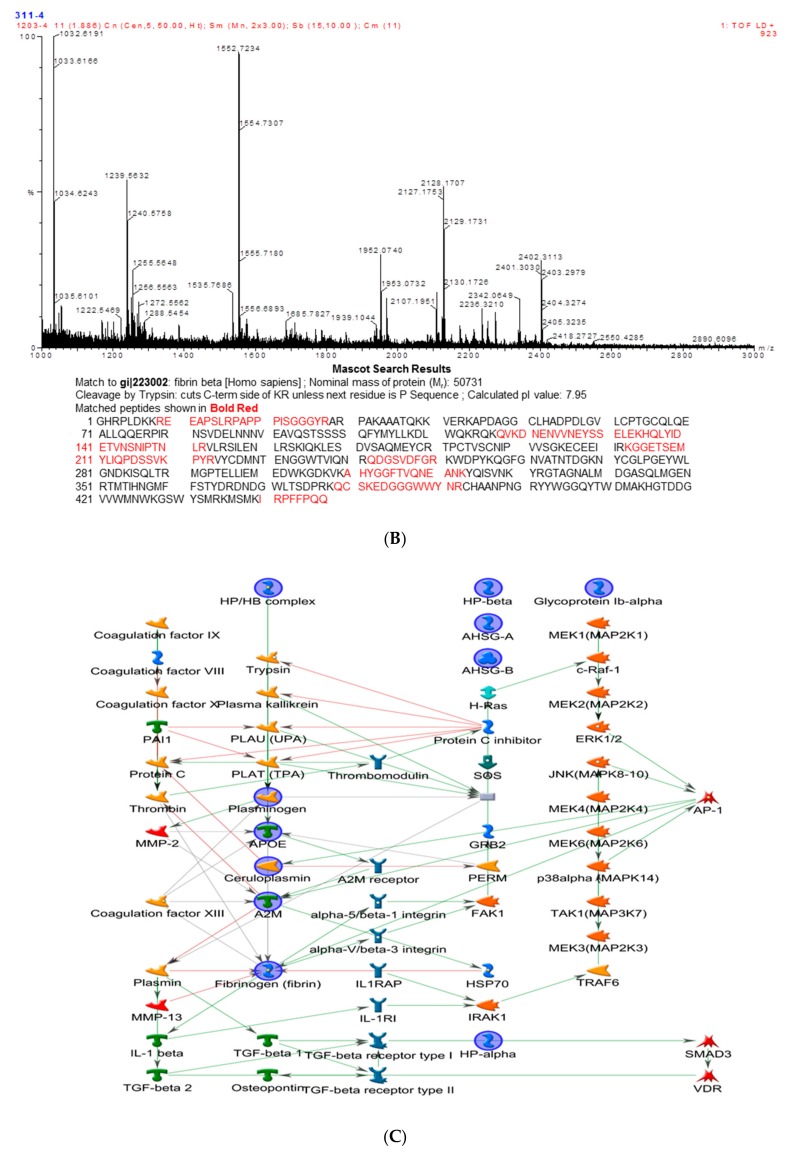
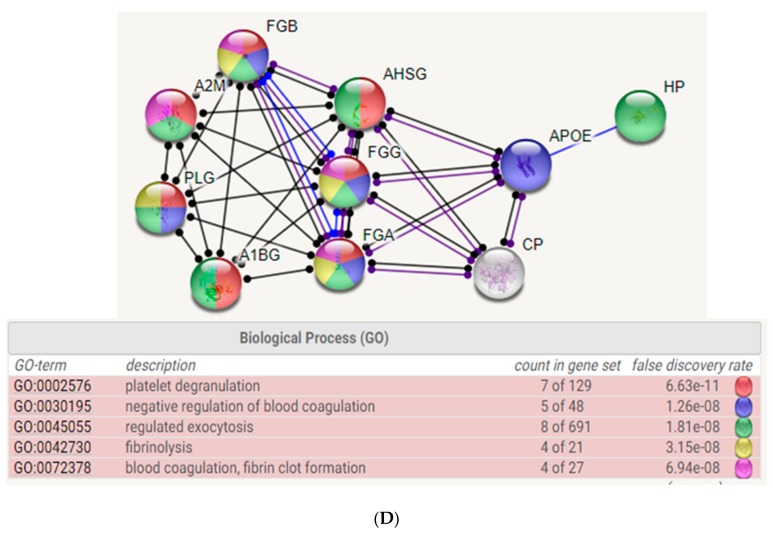
(A) Silver-stained 2-DE patterns of plasma and plasma depleted of albumin. N: health donor; WD: Wilson’s disease patients. Most albumins in plasma samples from health donor and WD were removed by using a Millipore Montage Albumin Deplete kit. The protein spots with significantly increasing intensity were labeled as Arabic numerals. Of these thirty one spots, 4 spots which appeared in normal samples were expressed in high level. Conversely, the other 14 spots were found in more abundant quantity for WD samples. (B) Peptide mass fingerprints of human fibrinogen β chain by. After 2-DE separation, spots was digested with trypsin and applied to MALDI-TOF mass spectrum which marked 9 in Table 1. By mean of Mascort software, 13 peptides with m/z values could be matched to accession number from Swiss-Prot database. Matched peptides showed with underline within the internal amino acid sequence of fibrinogen β chain. (C) Biological network analyses of differentially expressed proteins using MetaCore™ mapping tools. Nodes represent proteins and lines between the nodes indicate direct protein–protein interactions. The various proteins on this map are indicated by different symbols representing the functional class of the proteins. (D) Top-ranked pathways from the GeneGo MetaCore pathway analysis. Pathways were ranked according to p values.


