Figure 6.
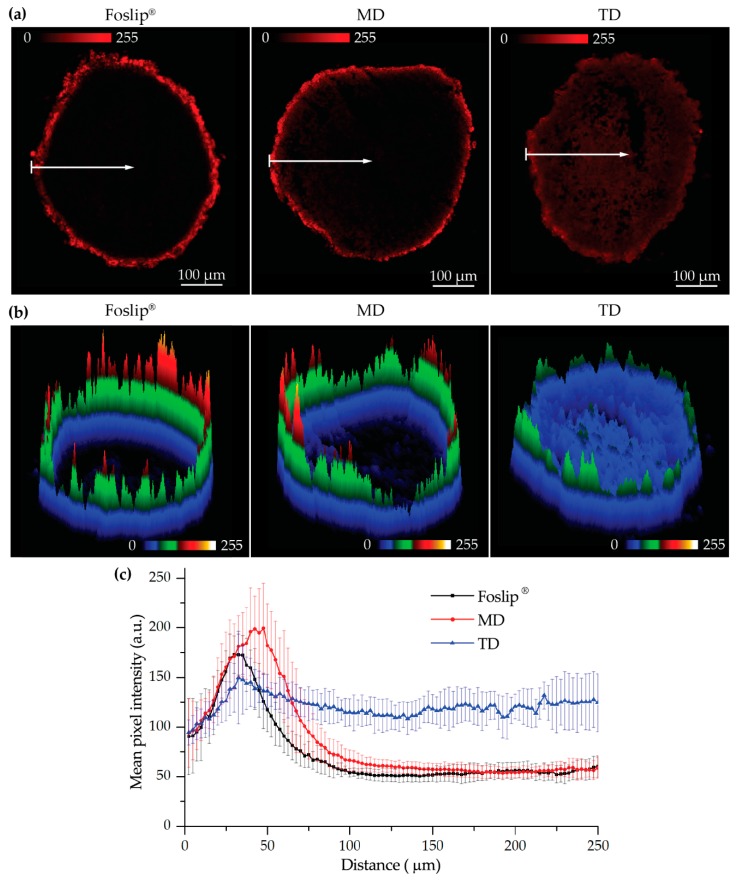
(a) Typical fluorescence images and corresponding (b) surface plots of mTHPC fluorescence in HT29 spheroids after 24 h incubation with various mTHPC formulations (Foslip®, MD, and TD); (c) penetration profiles of Foslip® (black), MD (red), and TD (blue) in HT29 spheroids after 24 h. The data are presented as mean ± standard deviation obtained from n = 7 spheroids. mTHPC concentration was 4.5 μM. Serum concentration was 2%. mTHPC fluorescence is displayed in red color (2D images) and in pseudo-colors (3D surface plots).

