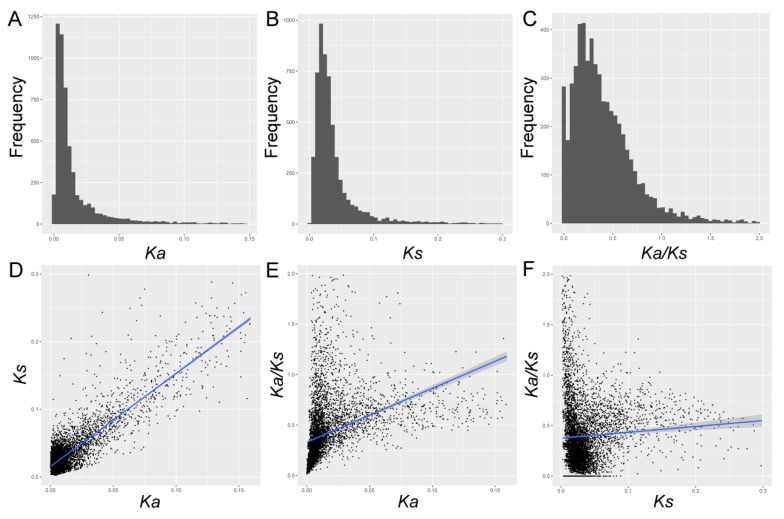
Figure 1.
The frequency distributions (A–C) and correlation analyses (D–F) of Ka, Ks, and Ka/Ks. (A–C) The frequency displays of Ka, Ks, and Ka/Ks, respectively. (D) The correlation between Ka and Ks. (E) The correlation between Ka/Ks and Ka. (F) The correlation between Ka/Ks and Ks. The blue line represented the fitted curve, and the shaded part represented the confidence interval.

