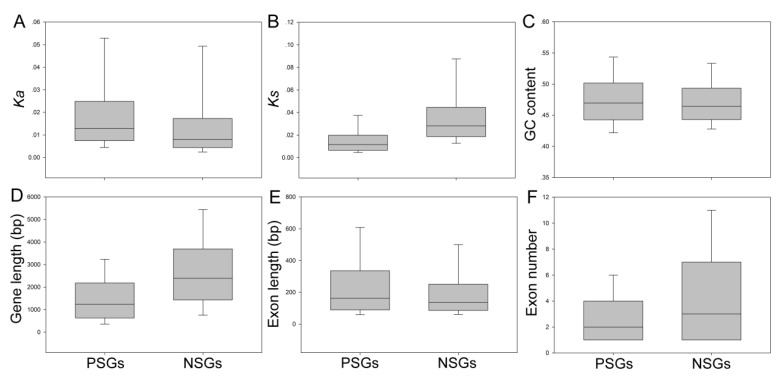
Figure 2.
Comparisons of genomic features among different types of negatively selected genes (NSGs) and positively selected genes (PSGs) in Pyrus. The top and the bottom of each box were the third (higher) and first (lower) quartiles. The line represented the median value in the box. Out of range, mild outliers are excluded in this figure. (A–F) The box plot displays of Ka, Ks, GC content, gene length, exon length, and exon number between two selections.

