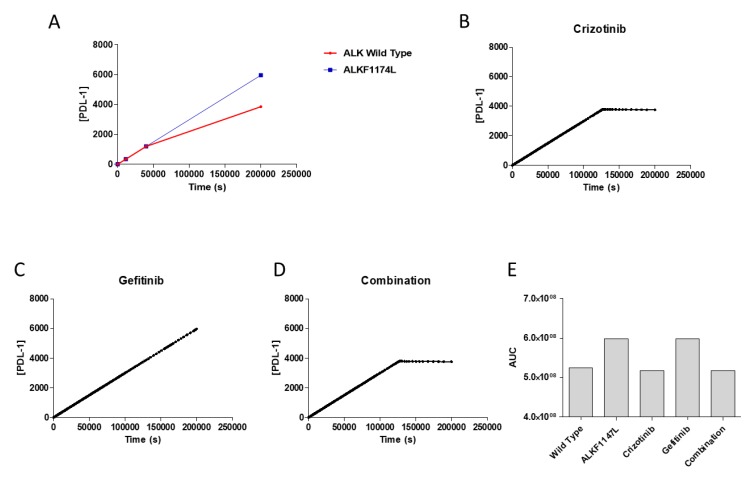
Figure 4.
Expression of PD-L1 in a neuroblastoma cell line with and without ALK mutation (A). (B) Expression of PD-L1 after treatment with 1.4 × 10⁻³ mM crizotinib therapy (C), 3 × 10⁻³ mM gefitinib therapy (D) and a combination of the two inhibitors (E). The simulation was conducted from 0 to 2 × 10⁵ s., using the deterministic (LSODA) method. All concentrations are in mmol/mL. Comparison of the cumulative area under the curves (AUCs) of PD-L1 expression without therapy and with different therapy regimens (F).

