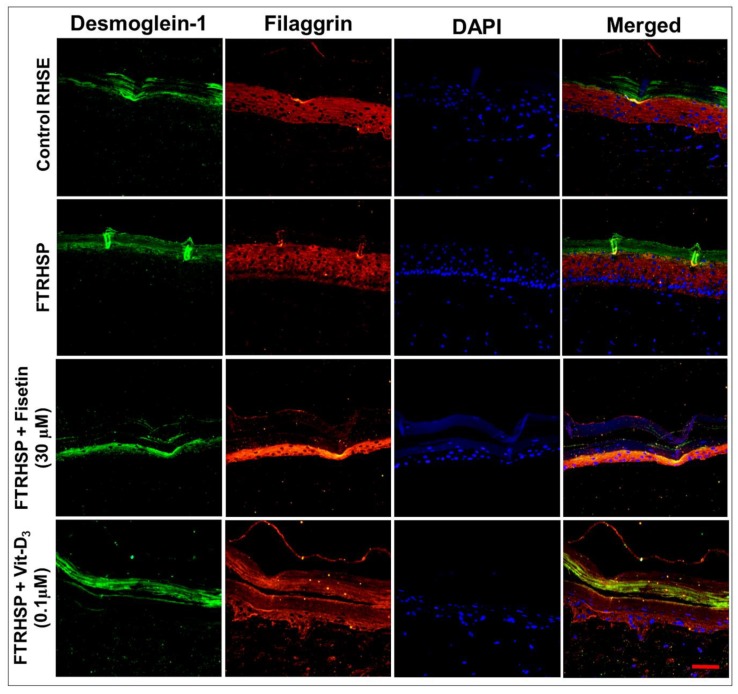
Figure 9.
Representative immunofluorescent photomicrographs showing the protein expression levels of differentiation (filaggrin) and desmosomal (desmoglein-1) protein markers in control RHSE and FTRHSP under different treatment conditions versus fisetin or Vit-D3-treated FTRHSP tissues. Results are representative of three independent experiments each performed in quadruplicate and comparing control RHSE vs. FTRHSP treated groups. Data green (Dsgl-1); red (filaggrin), blue (DAPI) and mixed is merged representation. Dsgl-1 = desmoglein-1. Scale bar = 20 μm.

