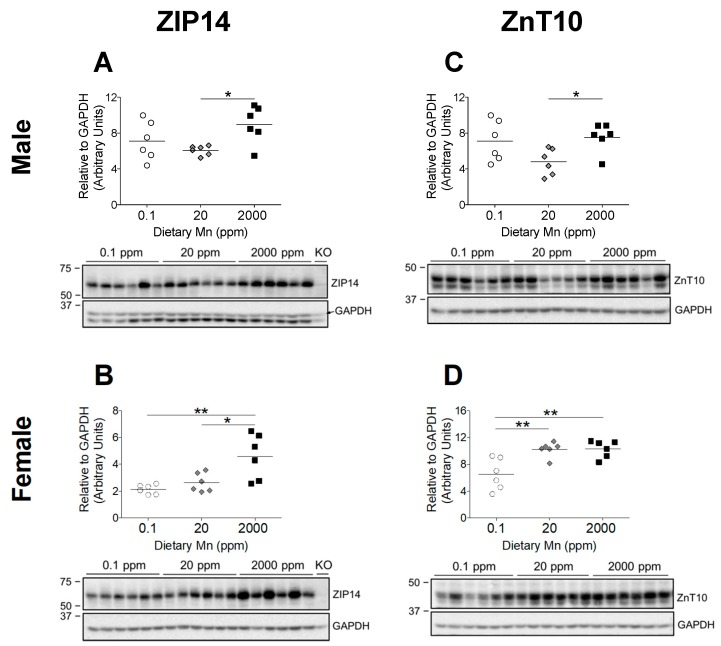
Figure 6.
Comparison of transporter protein levels in the liver. Expression of (A and B) ZIP14 and (C and D) ZnT10 in male and female mice on 0.1, 20, and 2000 ppm Mn diets (n = 6/sex). Liver samples were obtained at 12 weeks of age and analyzed via western blot. Quantifications of protein levels were performed using GAPDH as a loading control. ZIP14 blots also include results from an age-matched Zip14 knockout (KO) mouse as a control (fed traditional rodent diet). Data expressed as mean ± SEM. * p < 0.05, ** p < 0.01.

