Figure 4.
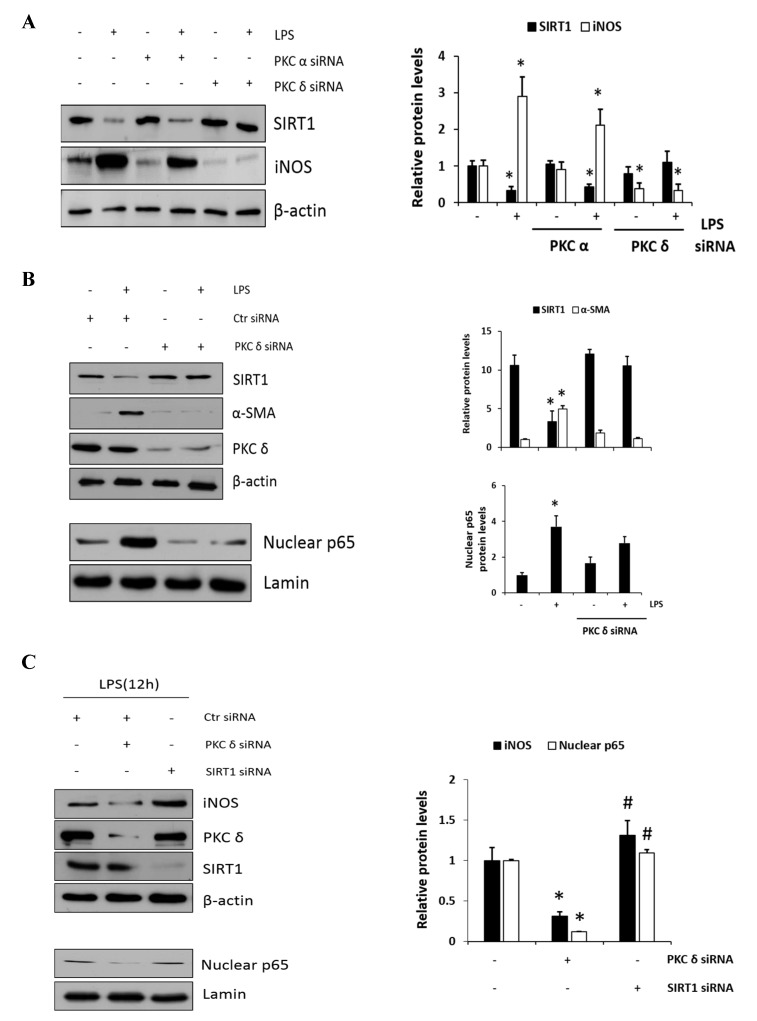
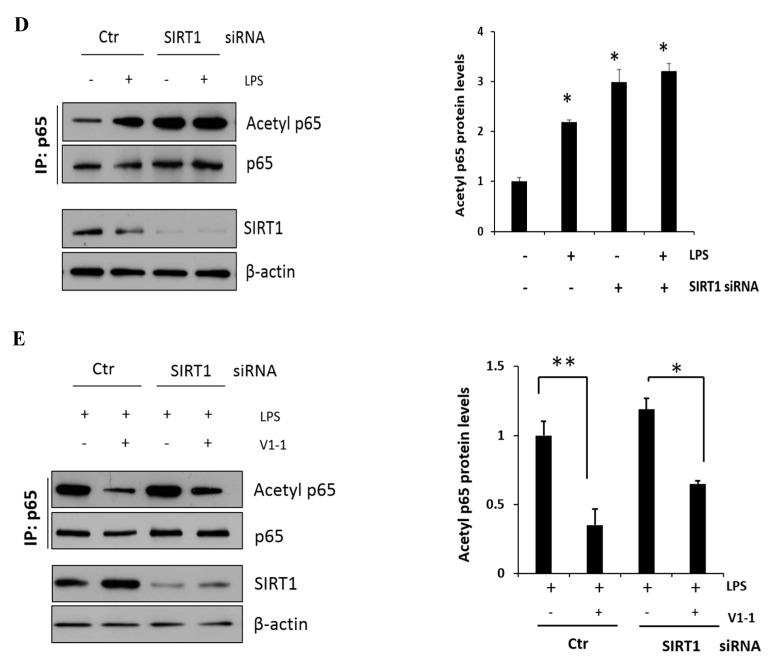
A negative cross reaction between NF-κB and SIRT1 activation in RAW 264.7 macrophages. (A) RAW 264.7 cells were transfected with PKCα or PKCδ siRNA for 24 h, and then, the cells were either not treated or treated with LPS (1 μg/mL) followed by the measurement of SIRT1 and iNOS. (B) Cells were transfected with control or PKCδ siRNA, and after 24 h, cells were either not treated or treated with LPS (1 μg/mL), followed by the measurement of SIRT1 and α-SMA. Similarly, the levels of nuclear p65 were also measured with lamin. The relative amounts of the above proteins are presented as fold-increase. The data represent three independent experiments. * p < 0.05 compared with control. (C) Cells were transfected with PKCδ or SIRT1 siRNA after 24 h and then treated with LPS (1 μg/mL) followed by the measurement of iNOS with the transfectant proteins PKCδ and SIRT1. The lower panel shows the level of nuclear p65 expression with lamin as the loading control. * p < 0.05 compared with control siRNA; # p < 0.05 compared with the PKCδ siRNA. (D) Cells were transfected with SIRT1 siRNA for 24 h, and then, the cells were either not treated or treated with LPS (1 μg/mL) for 1 h. p65 was immunoprecipitated with anti-p65 antibody using whole-cell lysate and then immunoblotted against acetyl-lysine using the same amount of the precipitate. The lower panel confirms the dependency of siRNA transfection on SIRT1 expression. * p < 0.05 compared with control. (E) Similarly, the effects of PKCδ and SIRT1 on the acetyl p65 level in the presence of LPS were shown. The control and SIRT1 siRNA transfected cells were pretreated with or without V1-1 for 1 h, followed by incubation with 1 μg/mL LPS additional. * p < 0.05 and ** p < 0.01 compared with LPS-induced cells in the absence of V1-1.


