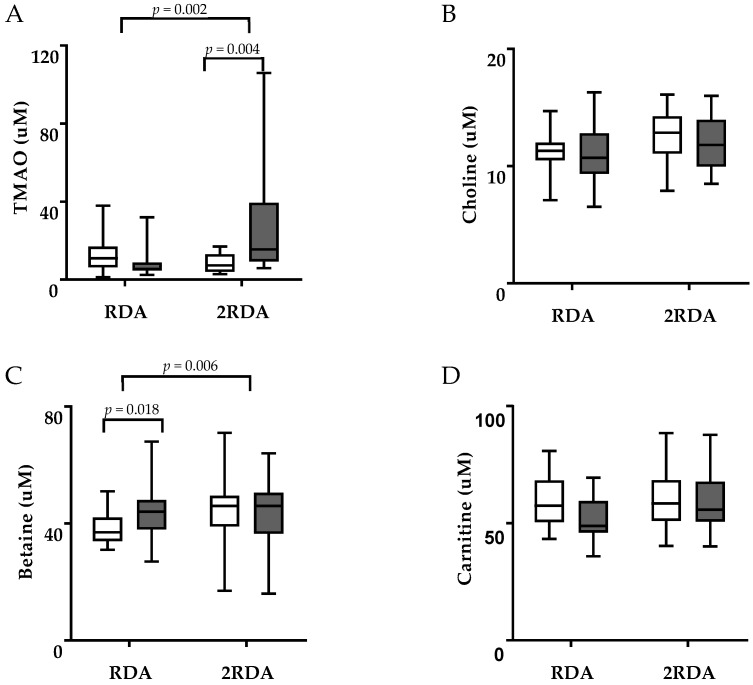
Figure 1.
Box-whisker plots illustrating concentrations of (A) TMAO, (B) choline, (C) betaine, (D) carnitine in plasma of the RDA and 2RDA groups pre-intervention (uncoloured boxes) and after 10 weeks (coloured boxes). The central lines represent means and the error bars represent minimum and maximum values. TMAO: trimethylamine-N-oxide. Two-way repeated measures ANOVA was used for comparison and the difference between time points in same group was controlled using the Sidak post hoc procedure.

