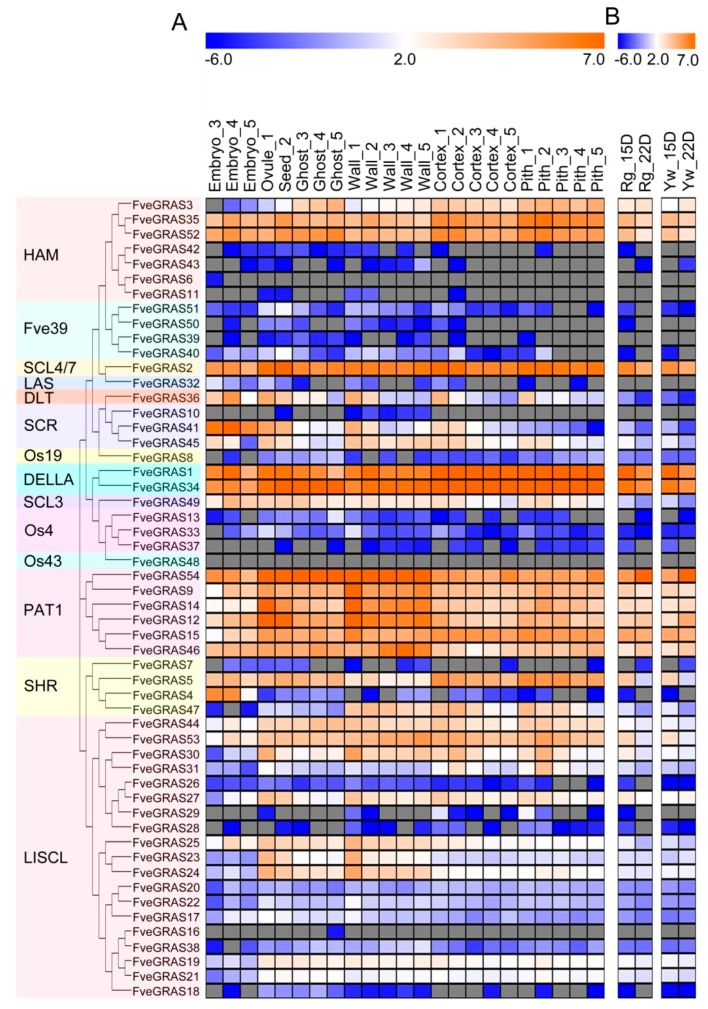
Figure 5.
Expression pattern of GRAS genes in developing and ripening fruit tissues of woodland strawberry. (A) Expression pattern of GRAS genes in developing fruit tissues (including embryo, ovule, ghost, wall, cortex and pith). (B) Expression change of GRAS genes from immature to ripening fruits in two varieties “Ruegen” and “Yellow Wonder”. RPKM values in (A,B) downloaded from Li et al. (2019) [43] were in Supplementary Tables S7 and S8, and the heat map showed log2 level. Numbers after tissues in (A) represent different developmental stages: Stage 1 (pre-fertilization), stage 2 (2–4 days post-anthesis (DPA)), stage 3 (6–9 DPA), stage 4 (8–10 DPA) and stage 5 (10–13 DPA). Rg and Yw in (B) represent “Ruegen” and “Yellow Wonder”, and 15D and 22D represent 15 and 22 DPA.

