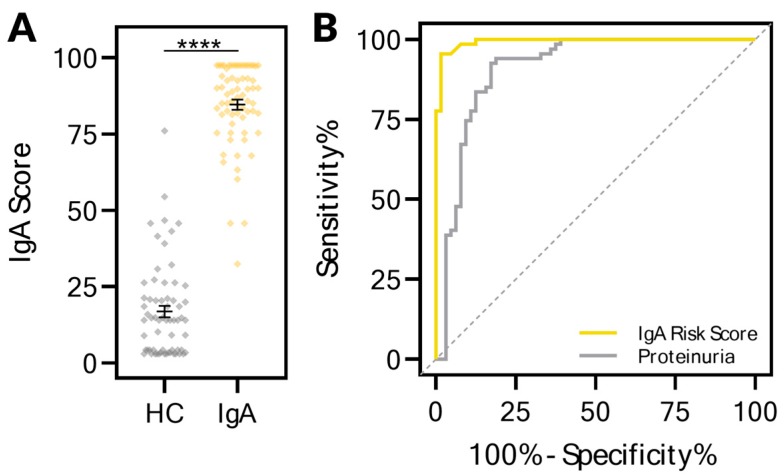
Figure 3.
The urinary KIT biomarkers could segregate healthy controls from those with IgA nephropathy. (A) An IgA risk score ranging from 0 to 100 segregated healthy control patients from those with IgA nephropathy. Urine samples were collected from healthy controls (n = 64) who had no evidence of kidney disease or injury as assessed by both absence of proteinuria and eGFR greater than 120. All urine samples from IgA patients (n = 67) were used, as none of these patients had remission of IgA during the treatment duration. (B) Receiver–operator characteristic (ROC) curves of the IgA risk score with AUC of 0.994 (p < 0.0001) and proteinuria. For the IgA risk score, the sensitivity and specificity were 95.5% and 98.4% respectively. **** p < 0.0001.

